Original Link: https://www.anandtech.com/show/7852/intel-xeon-e52697-v2-and-xeon-e52687w-v2-review-12-and-8-cores
Intel Xeon E5-2697 v2 and Xeon E5-2687W v2 Review: 12 and 8 Cores
by Ian Cutress on March 17, 2014 11:59 AM EST- Posted in
- CPUs
- Intel
- Xeon
- Enterprise
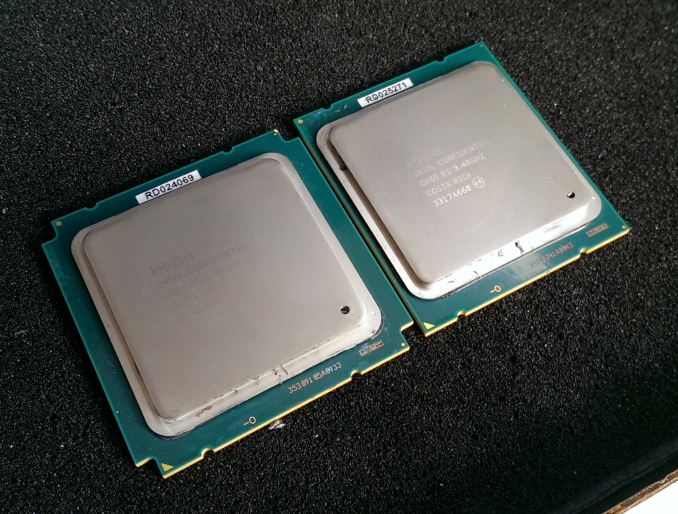
Intel’s roadmap goes through all the power and market segments, from ultra-low-power, smartphones, tablets, notebooks, desktops, mainstream desktops, enthusiast desktops and enterprise. Enterprise differs from the rest of the market, requiring absolute stability, uptime and support should anything go wrong. High-end enterprise CPUs are therefore expensive, and because buyers are willing to pay top dollar for the best, Intel can push core counts, frequency and thus price much higher than in the consumer space. Today we look at two CPUs from this segment – the twelve core Xeon E5-2697 v2 and the eight core Xeon E5-2687W v2.
Firstly I would like to say a big thank you to GIGABYTE Server for the opportunity to test these CPUs in their motherboard, the GA-6PXSV3. This motherboard is the focus of a review at a later date.
Intel’s Enterprise Line
High-end enthusiasts always want hardware to be faster, more powerful, and contain more cores than what is available on the market today. The problem here is two-fold: cost and volume. Were Intel to produce a product for the consumer market at more than $1000, a large part of the market would complain that the ultra-high-end is too expensive. The other issue is volume – it can be hard to gauge just how many CPUs would be sold. For example, the consumer level i7-4930K was the preferred choice for many enthusiasts as it was several hundred dollars cheaper than the i7-4960X despite being a fraction slower at stock frequencies. The ultra-high-end enthusiast also wants all the bells and whistles, such as overclockability, a good range of DRAM speed support and top quality construction materials.
At some point, Intel has to draw the line. The enterprise line of CPUs is different to the consumer in more ways than we might imagine. Due to the requirements of stability, overclocking is knocked on the head for all modern Intel Xeon CPUs. For clarification, the Westmere-EX CPU line (Xeon X5760 et al., socket 1366) was the last line of overclockable Xeons. The Xeon line of CPUs must also support enterprise level memory – UDIMMs and RDIMMs, ECC and non-ECC. This leads up to quad-rank DRAM support, such as 32GB modules that themselves can cost more than a CPU.
Some enterprise CPUs are also designed to speak to other CPUs in multiprocessor systems. On the Intel side, this means a point-to-point QPI link between each CPU in the system. Johan and I have recently tested several multiprocessor systems [1,2,3,4] and as such these features develop over time, cost R&D, and are focused purely on the enterprise sector.
Virtualization is also another feature Intel limits to certain CPUs, although both some consumer and some enterprise Xeons have them. The defining counterpart tends to be overclockability – if a consumer CPU is listed as overclockable, it does not have VT-d extensions for directed I/O. For users that want ECC memory and virtualization at a lower cost, the enterprise product stack often offers lower core/lower frequency parts at lower price points.
While not necessarily verifiable, there have been reports that Xeon processors are actually the better quality samples that come from the fabs. These are CPUs that have better frequency-to-voltage characteristics and have better chance of running cooler. The main reason this report exists is that when Xeons were overclockable back in Westmere, they were more likely to overclock further than the consumer versions. Also it would make sense from Intel’s point of view – the enterprise customer is paying more for their hardware, and as such a better product in terms of energy consumption or thermals would keep those customers happy.
The Xeon Product Line
Intel splits the naming of its Xeons up according to feature set and architecture. For single processor systems using the LGA1150 socket, we get the E3 line of Xeons which at this present time are based on the Haswell architecture and all come under the E3-12xx v3 line:
| Intel E3 v3 SKUs | |||||||
| Xeon E3 v3 | Cores | TDP (W) | IGP | Base Clock | Turbo Clock | L3 Cache | Price |
| E3-1220L v3 | 2/4 | 13 | N/A | 1100 | 1500 | 4 MB | $193 |
| E3-1220 v3 | 4/4 | 80 | N/A | 3100 | 3500 | 8 MB | $193 |
| E3-1225 v3 | 4/4 | 84 | P4600 | 3200 | 3600 | 8 MB | $213 |
| E3-1230 v3 | 4/8 | 80 | N/A | 3300 | 3700 | 8 MB | $240 |
| E3-1240 v3 | 4/8 | 80 | N/A | 3400 | 3800 | 8 MB | $262 |
| E3-1245 v3 | 4/8 | 84 | P4600 | 3400 | 3800 | 8 MB | $276 |
| E3-1270 v3 | 4/8 | 80 | N/A | 3500 | 3900 | 8 MB | $328 |
| E3-1275 v3 | 4/8 | 84 | P4600 | 3500 | 3900 | 8 MB | $339 |
| E3-1280 v3 | 4/8 | 82 | N/A | 3600 | 4000 | 8 MB | $612 |
| E3-1285 v3 | 4/8 | 84 | P4700 | 3600 | 4000 | 8 MB | $662 |
| E3-1265L v3 | 4/8 | 45 | HD (Haswell) | 2500 | 3700 | 8 MB | $294 |
| E3-1284L v3 | 4/8 | 47 | Iris Pro 5200 | 1800 | 3200 | 6 MB | N/A |
| E3-1285L v3 | 4/8 | 65 | P4700 | 3100 | 3900 | 8 MB | $774 |
| E3-1230L v3 | 4/8 | 25 | N/A | 1800 | 2800 | 8 MB | $250 |
With Intel’s enthusiast socket, LGA2011, the processors are now split according to their multi-processor capability. Due to the skip-tock cadence of architecture improvements at this level the enthusiast consumer and Xeon line are both one architecture behind the mainstream LGA1150 CPU line. This results in all the LGA2011 Xeons being based on Ivy Bridge-E.
Single processor LGA2011 Xeons are under the title of E5-16xx v2. Dual processor system capable Xeons are E5-26xx v2, and quad processor system capable Xeons are E5-46xx v2. As Johan pointed out in his excellent dive into the improvements over the older architecture, these CPUs come from three die flavors:
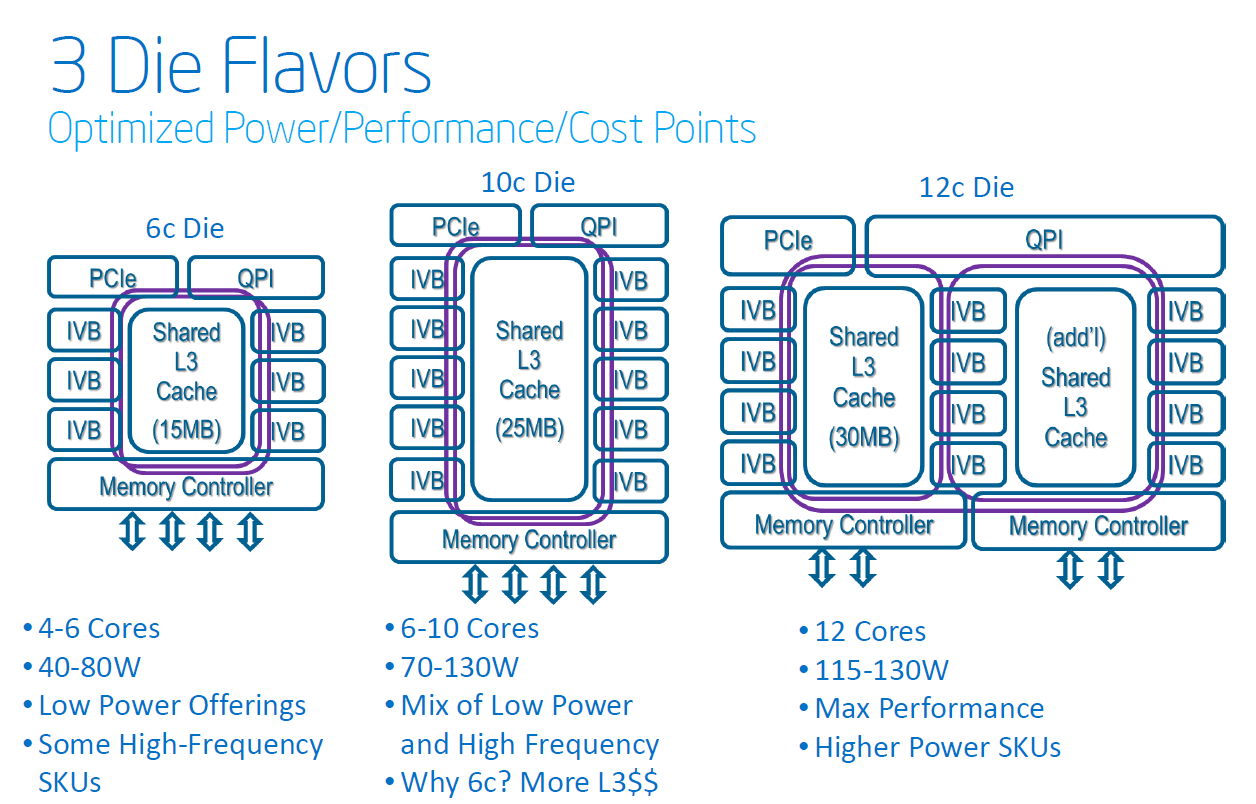
The three dies are aimed at workstations/enthusiasts, servers and high performance computing respectively. I’m not going to repeat what Johan already posted, but it is a really good read if you have a chance to look through it.
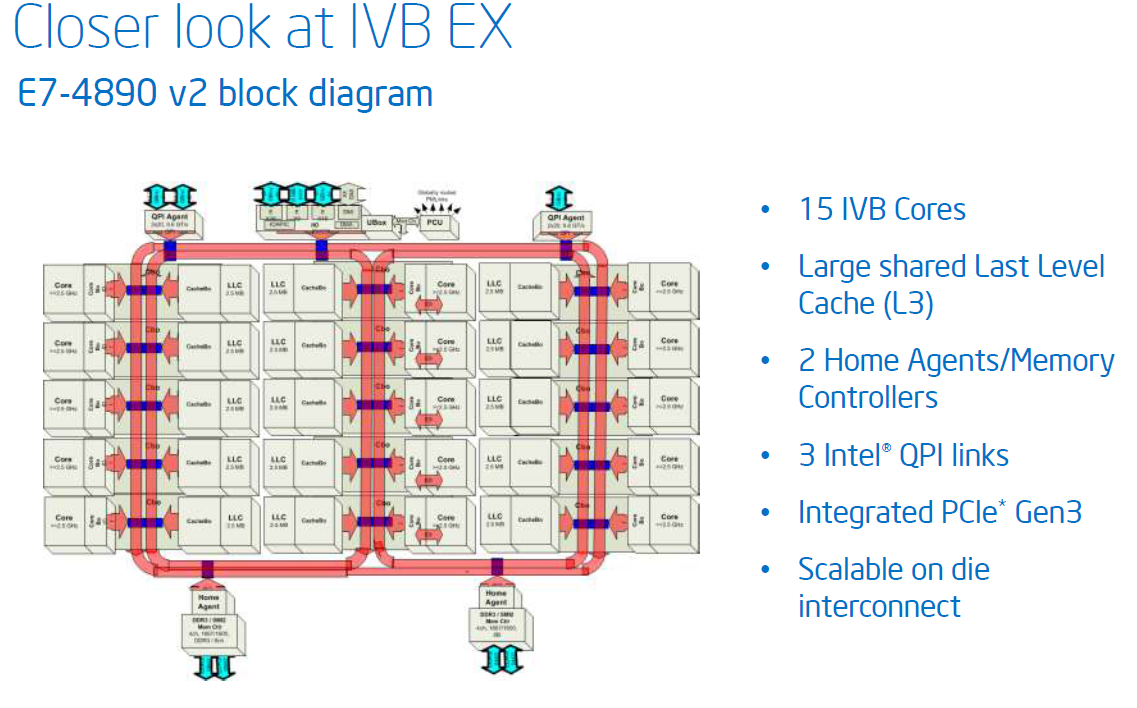
The final batch of processors are in the high performance category, using the LGA2011-1 socket. These have been recently released as the E7 v2 line (again I will point a link to Johan’s deep dive on the specifics) under the Ivy Bridge-EX moniker. We have E7-28xx v2 for 2P, E7-48xx v2 for 4P and E7-88xx v2 for 8P systems. Cores for these CPUs go all the way up to 15 due to the three banks of five used in the die.
Turbo Modes
As with the consumer line, the base clock speed of an enterprise CPU is usually not the be-all and end-all of performance. Intel’s Turbo Boost lets the CPU speed up when fewer cores are in use, exercising the difference in power consumption of one core, two core or all-core computation. There is no hard and fast rule when it comes to the turbo modes – Intel will quote the top turbo bin in its CPU database ark.intel.com but in order to find out the scale of multi-core (but not all-core) operation, one has to look into the specification pdfs, such as this one.
With over 50 different CPUs mentioned in that document, it is hard to see which CPUs are going to offer more than others. We extracted the data:
| Intel E5 SKU Comparison | |||||||
| Xeon E5 | Cores | TDP (W) | Base Clock | Turbo Bins | L3 Cache | L3 Cache / Core | Price |
| E5-46xx | |||||||
| E5-4657L v2 | 12/24 | 115 | 2400 | 5/4/3/3/3/3/3/3/3/3/3/3 | 30 MB | 2.500 | $4,394 |
| E5-4650 v2 | 10/20 | 95 | 2400 | 5/4/3/3/3/3/3/3/3/3 | 25 MB | 2.500 | $3,616 |
| E5-4640 v2 | 10/20 | 95 | 2200 | 5/4/3/3/3/3/3/3/3/3 | 20 MB | 2.000 | $2,725 |
| E5-4624L v2 | 10/20 | 70 | 1900 | 6/6/5/5/4/4/3/3/2/2 | 25 MB | 2.500 | $2,405 |
| E5-4627 v2 | 8/8 | 130 | 3300 | 3/2/2/2/2/2/2/2 | 16 MB | 2.000 | $2,180 |
| E5-4620 v2 | 8/16 | 95 | 2600 | 4/3/2/2/2/2/2/2 | 20 MB | 2.500 | $1,611 |
| E5-4610 v2 | 8/16 | 95 | 2300 | 4/3/2/2/2/2/2/2 | 16 MB | 2.000 | $1,219 |
| E5-4607 v2 | 6/12 | 95 | 2600 | 0/0/0/0/0/0 | 15 MB | 2.500 | $885 |
| E5-4603 v2 | 4/8 | 95 | 2200 | 0/0/0/0 | 10 MB | 2.500 | $551 |
| E5-x6xx | |||||||
| E5-2697 v2 | 12/24 | 130 | 2700 | 8/7/6/5/4/3/3/3/3/3/3/3 | 30 MB | 2.500 | $2,614 |
| E5-2695 v2 | 12/24 | 115 | 2400 | 8/7/6/5/4/4/4/4/4/4/4/4 | 30 MB | 2.500 | $2,336 |
| E5-2687W v2 | 8/16 | 150 | 3400 | 6/5/4/3/2/2/2/2 | 25 MB | 3.125 | $2,108 |
| E5-2667 v2 | 8/16 | 130 | 3300 | 7/6/5/4/3/3/3/3 | 25 MB | 3.125 | $2,057 |
| E5-2690 v2 | 10/20 | 130 | 3000 | 6/5/4/3/3/3/3/3/3/3 | 25 MB | 2.500 | $2,057 |
| E5-2658 v2 | 10/20 | 95 | 2400 | 6/6/5/5/4/4/3/3/2/2 | 25 MB | 2.500 | $1,750 |
| E5-1680 v2 | 8/16 | 130 | 3000 | 9/8/7/5/4/4/4/4 | 25 MB | 3.125 | $1,723 |
| E5-2680 v2 | 10/20 | 115 | 2800 | 8/7/6/5/4/3/3/3/3/3 | 25 MB | 2.500 | $1,723 |
| E5-2643 v2 | 6/12 | 130 | 3500 | 3/2/1/1/1/1 | 25 MB | 4.167 | $1,552 |
| E5-2670 v2 | 10/20 | 115 | 2500 | 8/7/6/5/4/4/4/4/4/4 | 25 MB | 2.500 | $1,552 |
| E5-2648L v2 | 10/20 | 70 | 1900 | 6/6/5/5/4/4/3/3/2/2 | 25 MB | 2.500 | $1,479 |
| E5-2660 v2 | 10/20 | 95 | 2200 | 8/7/6/5/4/4/4/4/4/4 | 25 MB | 2.500 | $1,389 |
| E5-2650L v2 | 10/20 | 70 | 1700 | 4/3/2/2/2/2/2/2/2/2 | 25 MB | 2.500 | $1,219 |
| E5-2628L v2 | 8/16 | 70 | 1900 | 5/5/4/4/3/3/2/2 | 20 MB | 2.500 | $1,216 |
| E5-2650 v2 | 8/16 | 95 | 2600 | 8/7/6/5/5/5/5/5 | 20 MB | 2.500 | $1,166 |
| E5-1660 v2 | 6/12 | 130 | 3700 | 3/2/1/1/1/1 | 15 MB | 2.500 | $1,080 |
| E5-2637 v2 | 4/8 | 130 | 3500 | 3/2/1/1 | 15 MB | 3.750 | $996 |
| E5-2640 v2 | 8/16 | 95 | 2000 | 5/4/3/3/3/3/3/3 | 20 MB | 2.500 | $885 |
| E5-2618L v2 | 6/12 | 50 | 2000 | 0/0/0/0/0/0 | 15 MB | 2.500 | $632 |
| E5-2630 v2 | 6/12 | 80 | 2600 | 5/4/3/3/3/3 | 15 MB | 2.500 | $612 |
| E5-2630L v2 | 6/12 | 60 | 2400 | 4/3/2/2/2/2 | 15 MB | 2.500 | $612 |
| E5-1650 v2 | 6/12 | 130 | 3500 | 4/2/2/2/1/1 | 12 MB | 2.000 | $583 |
| E5-2620 v2 | 6/12 | 80 | 2100 | 5/4/3/3/3/3 | 15 MB | 2.500 | $406 |
| E5-1620 v2 | 4/8 | 130 | 3700 | 2/0/0/0 | 10 MB | 2.500 | $294 |
| E5-2609 v2 | 4/4 | 80 | 2500 | 0/0/0/0 | 10 MB | 2.500 | $294 |
| E5-1607 v2 | 4/4 | 130 | 3000 | 0/0/0/0 | 10 MB | 2.500 | $244 |
| E5-2603 v2 | 4/4 | 80 | 1800 | 0/0/0/0 | 10 MB | 2.500 | $202 |
| E5-x4xx | |||||||
| E5-2470 v2 | 10/20 | 95 | 2400 | 8/7/6/5/4/4/4/4/4/4 | 25 MB | 2.500 | $1,440 |
| E5-2448L v2 | 10/20 | 70 | 1800 | 6/6/5/5/4/4/3/3/2/2 | 25 MB | 2.500 | $1,424 |
| E5-2450L v2 | 10/20 | 60 | 1700 | 4/3/2/2/2/2/2/2/2/2 | 25 MB | 2.500 | $1,219 |
| E5-2450 v2 | 8/16 | 95 | 2500 | 8/7/6/5/4/4/4/4 | 20 MB | 2.500 | $1,107 |
| E5-2428L v2 | 8/16 | 60 | 1800 | 5/5/4/4/3/3/2/2 | 20 MB | 2.500 | $1,013 |
| E5-2440 v2 | 8/16 | 95 | 1900 | 5/4/3/3/3/3/3/3 | 20 MB | 2.500 | $832 |
| E5-2430L v2 | 6/12 | 60 | 2400 | 4/3/2/2/2/2 | 15 MB | 2.500 | $612 |
| E5-2418L v2 | 6/12 | 50 | 2000 | 0/0/0/0 | 15 MB | 2.500 | $607 |
| E5-1428L v2 | 6/12 | 60 | 2200 | 5/4/3/2/2/2 | 15 MB | 2.500 | $474 |
| E5-2420 v2 | 6/12 | 80 | 2200 | 5/4/3/3/3/3 | 15 MB | 2.500 | $406 |
| E5-2407 v2 | 4/4 | 80 | 2400 | 0/0/0/0 | 10 MB | 2.500 | $250 |
| E5-2403 v2 | 4/4 | 80 | 1800 | 0/0/0/0 | 10 MB | 2.500 | $192 |
| Pentium 1405 v2 | 2/2 | 40 | 1400 | 0/0 | 6 MB | 3.000 | $156 |
| E5-1410 v2 | 4/8 | 80 | 2800 | 4/4/3/3 | 10 MB | 2.500 | N/A |
| Pentium 1403 v2 | 2/2 | 80 | 2600 | 0/0 | 6 MB | 3.000 | N/A |
But even this is hard to parse. Some CPUs start off at 3.0 GHz base frequency and have a 900 MHz turbo bin, whereas others move no more than 300 MHz from their base clock. A few CPUs are worthy of attention from our analysis:
The E5-2643 v2 has the most L3 Cache per core of any CPU, at 4.16 MB/core. This is a 10c die offering all 25 MB of L3 cache, but only six cores are active. Reasons for this include database applications that need a large amount of L3 cache per core. For licensing agreements that hinge on per-core pricing, having a larger amount of L3 per core could help save some money by needing fewer cores.
The E5-2667 v2 is a better chip than the E5-2687W v2. The latter gets attention due to its 150W TDP, high base clock and having a ‘W’ in the name. This is partly why I requested it for this review. But the E5-2667 v2 sounds better – a lower TDP (130W vs. 150W), and when you apply all the turbo bins into operation, both CPUs have the same frequency vs. core loading. Both CPUs have a maximum turbo bin of 4.0 GHz, moving down identically to an all-core loading of 3.6 GHz. The E5-2667 v2 is also a cheaper option, and according to the specification sheets can use 768 GB of memory per core, compared to the E5-2687W v2 which can only manage 256 GB.
Low power CPU additions keep their turbo speeds higher for longer. If we look at the turbo bin for a mid-range low power CPU, such as the E5-2628L v2, it goes in pairs: 5/5/4/4/3/3/2/2. The non-low-power processors often end up having a high turbo bin which decreases quickly, such as the E5-2680 v2, which goes 8/7/6/5/4/3/3/3/3.
The Mac Pro (Late 2013)
When Anand reviewed the Mac Pro late last year, he received the full fat 12 core edition, using the E5-2697 v2 CPU with a 2.7 GHz rating. The CPU choices for the Mac Pro include 4, 6 and 8 core models, all with HyperThreading. Interestingly enough, the 4/6/8 core models all come from the E5-16xx line, meaning the CPUs are designed with single processor systems in mind. But to get to the 12 core/24 thread model at the high end, Apple used the E5-2697 v2, a processor optimized for dual CPU situations. Based on the die shots on the previous page, this has repercussions, but as Anand pointed out, it all comes down to power usage and turbo performance.
| Mac Pro (Late 2013) CPU Options | ||||||
| Intel CPU | E5-1620 v2 | E5-1650 v2 | E5-1680 v2 | E5-2697 v2 | ||
| Cores / Threads | 4 / 8 | 6 / 12 | 8 / 16 | 12 / 24 | ||
| CPU Base Clock | 3.7GHz | 3.5GHz | 3.0GHz | 2.7GHz | ||
| Max Turbo (1C) | 3.9GHz | 3.9GHz | 3.9GHz | 3.5GHz | ||
| L3 Cache | 10MB | 12MB | 25MB | 30MB | ||
| TDP | 130W | 130W | 130W | 130W | ||
| Intel SRP | $294 | $583 | ? | $2614 | ||
The Mac Pro is designed within a peak 450W envelope, and Intel has options with its CPUs. For the same TDP limit, Intel can create many cores as low frequency, or fewer cores at higher frequency. This is seen in the options on the Mac Pro – all the CPU choices have the same 130W TDP, but the CPU base clocks change as we rise up the core count. Moving from 4 cores to 8 cores keeps the maximum turbo (single core performance) at 3.9 GHz, but the base clock decreases the more cores are available. Finally at the 12-core model, the base frequency is at its lowest of the set, as well as the maximum turbo.
This has repercussions on workloads, especially for workstations. For the most part, the types of applications used on workstations are highly professional, and have big budgets with plenty of engineers designed to extract performance. That should bode well for the systems with more cores, despite the frequency per core being lower. However, it is not always that simple – the mathematics for the problem has to be able to take advantage of parallel computing. Simple programs run solely on one core because that is the easiest to develop, but if the mathematics wholly linear, then even enterprise software is restricted. This would lend a positive note to the higher turbo frequency CPUs. Intel attempts to keep the turbo frequency similar as long as it can while retaining the maximum TDP to avoid this issue; however at the 12-core model this is not possible. Quantifying your workload before making a purchase is a key area that users have to consider.
Benchmark Configuration
I talk about the Mac Pro a little because the processors we have for a ‘regular’ test today are 8-core and 12-core models. The 12-core is the same model that Anand tested in the Mac Pro – the Xeon E5-2697v2. The 8-core model we are testing today is different to the one offered in the Mac Pro, in terms of frequency and TDP:
| Intel SKU Comparison | |||
| Core i7-4960X | Xeon E5-2687W v2 | Xeon E5-2697 v2 | |
| Release Date | September 10, 2013 | September 10, 2013 | September 10, 2013 |
| Cores | 6 | 8 | 12 |
| Threads | 12 | 16 | 24 |
| Base Frequency | 3600 | 3400 | 2700 |
| Turbo Frequency | 4000 | 4000 | 3500 |
| L3 Cache | 15 MB | 25 MB | 30 MB |
| Max TDP | 130 W | 150 W | 130 W |
| Max Memory Size | 64 GB | 256 GB | 768 GB |
| Memory Channels | 4 | 4 | 4 |
| Memory Frequency | DDR3-1866 | DDR3-1866 | DDR3-1866 |
| PCIe Revision | 3.0 | 3.0 | 3.0 |
| PCIe Lanes | 40 | 40 | 40 |
| Multi-Processor | 1P | 2P | 2P |
| VT-x | Yes | Yes | Yes |
| VT-d | Yes | Yes | Yes |
| vPro | No | Yes | Yes |
| Memory Bandwidth | 59.7 GB/s | 59.7 GB/s | 59.7 GB/s |
| Price | $1059 | $2112 | $2618 |
The reason for this review is to put these enterprise class processors through the normal (rather than server) benchmarks I run at AnandTech for processors. Before I started writing about technology, as an enthusiast, it was always interesting to hear of the faster Xeons and how much that actually made a difference to my normal computing. I luckily have that opportunity and would like to share it with our readers.
The system set up is as follows:
| Test Setup | |
| Motherboards |
GIGABYTE GA-6PXSV3 MSI X79A-GD45 Plus for 3x GPU Configurations |
| Memory | 8x4 GB Kingston DDR3-1600 11-11-11 ECC |
| Storage | OCZ Vertex 3 256 GB |
| Power Supply | OCZ 1250 ZX Series |
| CPU Cooler | Corsair H80i |
| NVIDIA GPU | MSI GTX 770 Lightning 2GB |
| AMD GPU | ASUS HD 7970 3GB |
Many thanks to...
We must thank the following companies for kindly providing hardware for our test bed:
Thank you to GIGABYTE Server for providing us with the Motherboard and CPUs
Thank you to OCZ for providing us with 1250W Gold Power Supplies and SSDs.
Thank you to Kingston for the ECC Memory kit
Thank you to ASUS for providing us with the AMD HD7970 GPUs and some IO Testing kit.
Thank you to MSI for providing us with the NVIDIA GTX 770 Lightning GPUs.
Power Consumption
Power consumption was tested on the system as a whole with a wall meter connected to the OCZ 1250W power supply, while in a single MSI GTX 770 Lightning GPU configuration. This power supply is Gold rated, and as I am in the UK on a 230-240 V supply, leads to ~75% efficiency > 50W, and 90%+ efficiency at 250W, which is suitable for both idle and multi-GPU loading. This method of power reading allows us to compare the power management of the UEFI and the board to supply components with power under load, and includes typical PSU losses due to efficiency. These are the real world values that consumers may expect from a typical system (minus the monitor) using this motherboard.
While this method for power measurement may not be ideal, and you feel these numbers are not representative due to the high wattage power supply being used (we use the same PSU to remain consistent over a series of reviews, and the fact that some boards on our test bed get tested with three or four high powered GPUs), the important point to take away is the relationship between the numbers. These boards are all under the same conditions, and thus the differences between them should be easy to spot.
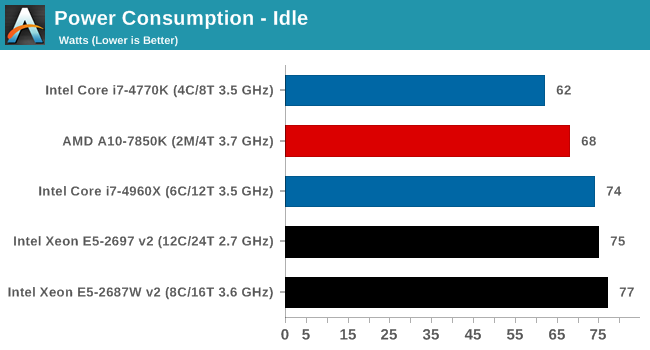
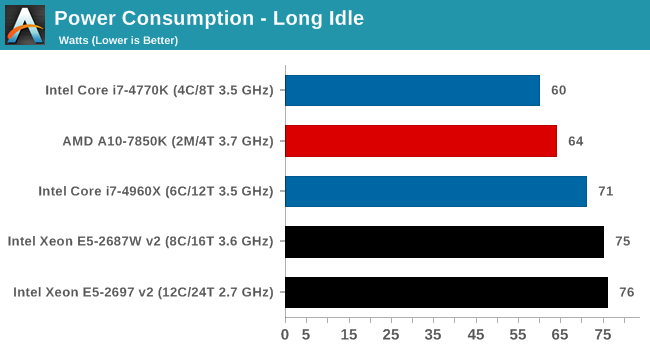
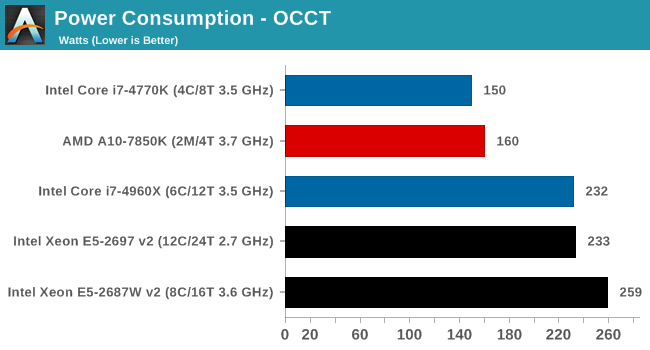
At idle, the Xeons are on par with the Core i7-4960X for power consumption in the GIGABYTE motherboard. At load the extra TDP of the E5-2687W v2 can be seen.
DPC Latency
Deferred Procedure Call latency is a way in which Windows handles interrupt servicing. In order to wait for a processor to acknowledge the request, the system will queue all interrupt requests by priority. Critical interrupts will be handled as soon as possible, whereas lesser priority requests, such as audio, will be further down the line. So if the audio device requires data, it will have to wait until the request is processed before the buffer is filled. If the device drivers of higher priority components in a system are poorly implemented, this can cause delays in request scheduling and process time, resulting in an empty audio buffer – this leads to characteristic audible pauses, pops and clicks. Having a bigger buffer and correctly implemented system drivers obviously helps in this regard. The DPC latency checker measures how much time is processing DPCs from driver invocation – the lower the value will result in better audio transfer at smaller buffer sizes. Results are measured in microseconds and taken as the peak latency while cycling through a series of short HD videos - less than 500 microseconds usually gets the green light, but the lower the better.
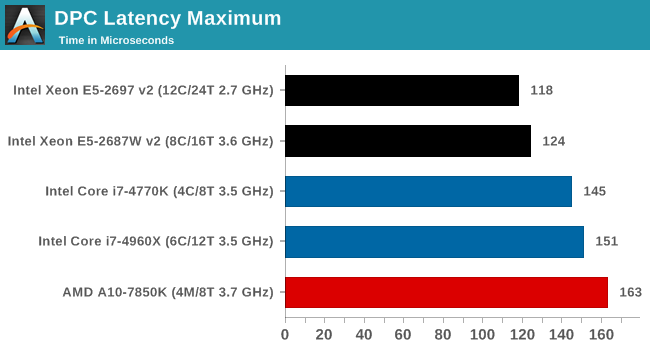
The DPC latency of the Xeons is closer to the 100 mark, which we saw during Sandy Bridge. Newer systems seem to be increasing the DPC latency - so far all Haswell consumer CPUs are at the 140+ line.
Real World CPU Benchmarks
Rendering – Adobe After Effects CS6: link
Published by Adobe, After Effects is a digital motion graphics, visual effects and compositing software package used in the post-production process of filmmaking and television production. For our benchmark we downloaded a common scene in use on the AE forums for benchmarks and placed it under our own circumstances for a repeatable benchmark. We generate 152 frames of the scene and present the time to do so based purely on CPU calculations.
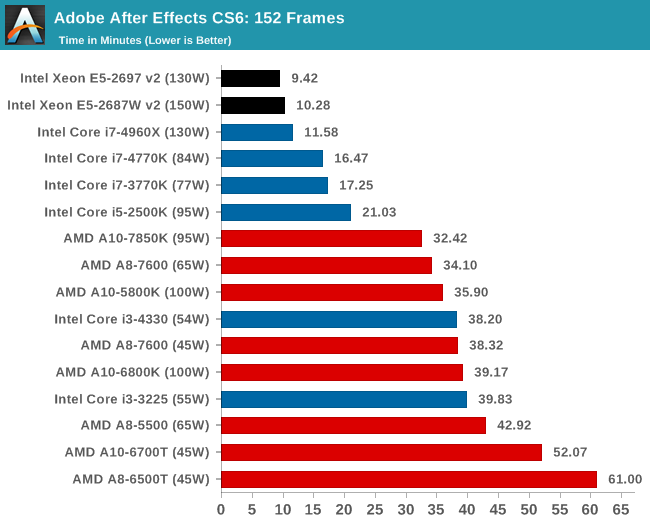
With AE6 being an optimized software package, more cores and threads rather than more MHz makes sense in our test.
Compression – WinRAR 5.0.1: link
Our WinRAR test from 2013 is updated to the latest version of WinRAR at the start of 2014. We compress a set of 2867 files across 320 folders totaling 1.52 GB in size – 95% of these files are small typical website files, and the rest (90% of the size) are small 30 second 720p videos.
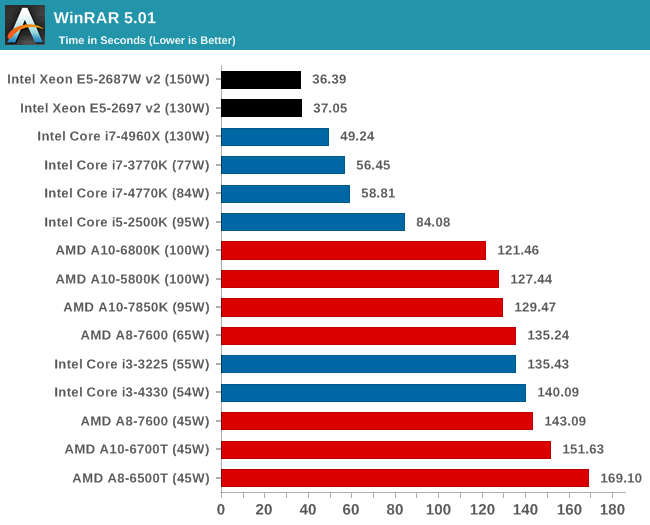
Due to the variable nature of the WinRAR test, our Xeons come out on top but it is hard to choose between them.
Image Manipulation – FastStone Image Viewer 4.9: link
Similarly to WinRAR, the FastStone test us updated for 2014 to the latest version. FastStone is the program I use to perform quick or bulk actions on images, such as resizing, adjusting for color and cropping. In our test we take a series of 170 images in various sizes and formats and convert them all into 640x480 .gif files, maintaining the aspect ratio. FastStone does not use multithreading for this test, and thus single threaded performance is often the winner.
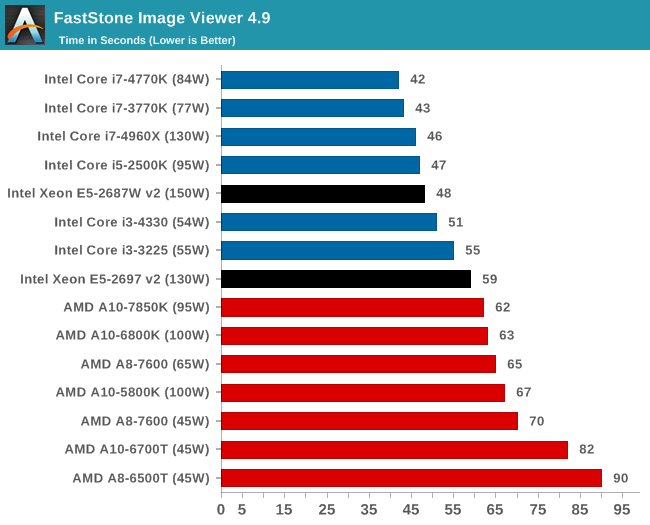
FastStone is a single threaded application where IPC and MHz matter. As a result, the newest architectures and platforms do better here than the Ivy Bridge-E based Xeons.
Video Conversion – Xilisoft Video Converter 7: link
The XVC test I normally do is updated to the full version of the software, and this time a different test as well. Here we take two different videos: a double UHD (3840x4320) clip of 10 minutes and a 640x266 DVD rip of a 2h20 film and convert both to iPod suitable formats. The reasoning here is simple – when frames are small enough to fit into memory, the algorithm has more chance to apply work between threads and process the video quicker. Results shown are in seconds and time taken to encode.
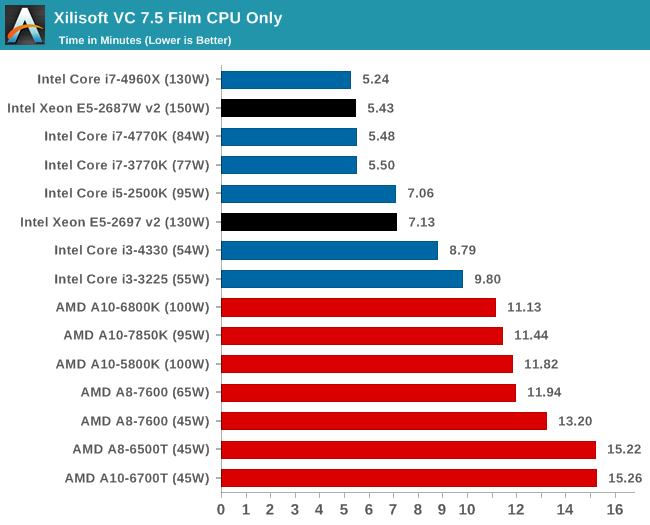
When going through lots of small frames, our XVC test working on one file prefers cores and threads over MHz.
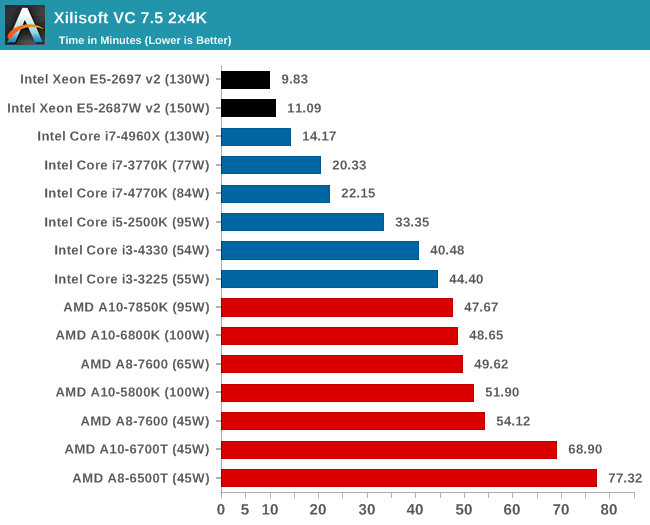
When the workload has some room to grow with larger frames, segments of each frame can be dispatched to cores more approprately and the 12-core Xeon comes out on top.
Video Conversion – Handbrake v0.9.9: link
Handbrake is a media conversion tool that was initially designed to help DVD ISOs and Video CDs into more common video formats. The principle today is still the same, primarily as an output for H.264 + AAC/MP3 audio within an MKV container. In our test we use the same videos as in the Xilisoft test, and results are given in frames per second.
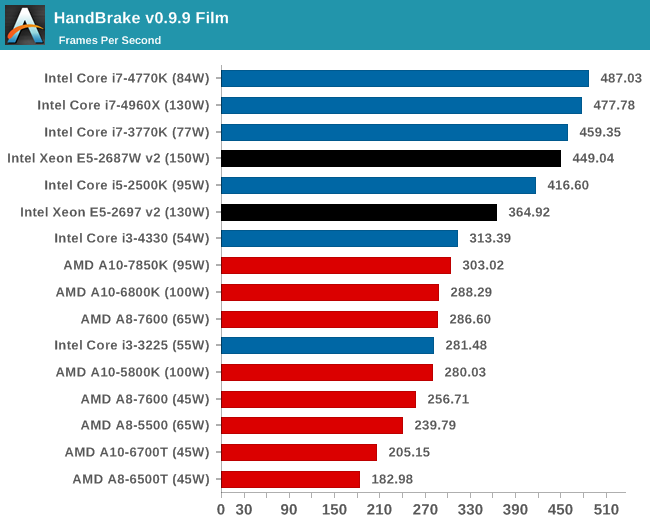
Similar to the XVC test, when the frames are small the software has to fight against thread dispatch of smaller pieces that get in the way of opening up the trottle.
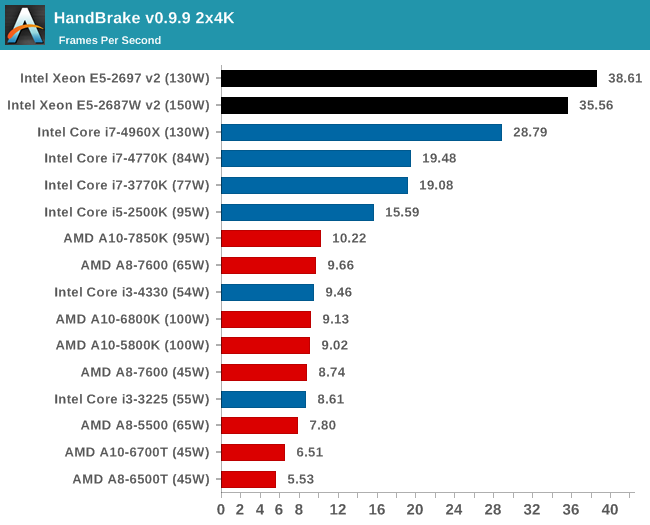
Move to larger frames again and the Xeons can use their full force. Cores over MHz wins here.
Rendering – PovRay 3.7: link
The Persistence of Vision RayTracer, or PovRay, is a freeware package for as the name suggests, ray tracing. It is a pure renderer, rather than modeling software, but the latest beta version contains a handy benchmark for stressing all processing threads on a platform. We have been using this test in motherboard reviews to test memory stability at various CPU speeds to good effect – if it passes the test, the IMC in the CPU is stable for a given CPU speed. As a CPU test, it runs for approximately 2-3 minutes on high end platforms.
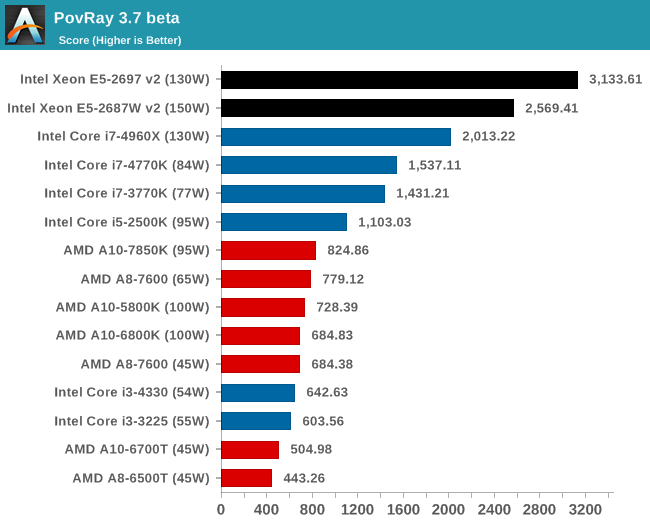
PovRay becomes an embarrassingly parallel benchmark where cores x frequency come out on top. This pattern of results is a common sight in our synthetic testing.
Scientific and Synthetic Benchmarks
2D to 3D Rendering –Agisoft PhotoScan v1.0: link
Agisoft Photoscan creates 3D models from 2D images, a process which is very computationally expensive. The algorithm is split into four distinct phases, and different phases of the model reconstruction require either fast memory, fast IPC, more cores, or even OpenCL compute devices to hand. Agisoft supplied us with a special version of the software to script the process, where we take 50 images of a stately home and convert it into a medium quality model. This benchmark typically takes around 15-20 minutes on a high end PC on the CPU alone, with GPUs reducing the time.
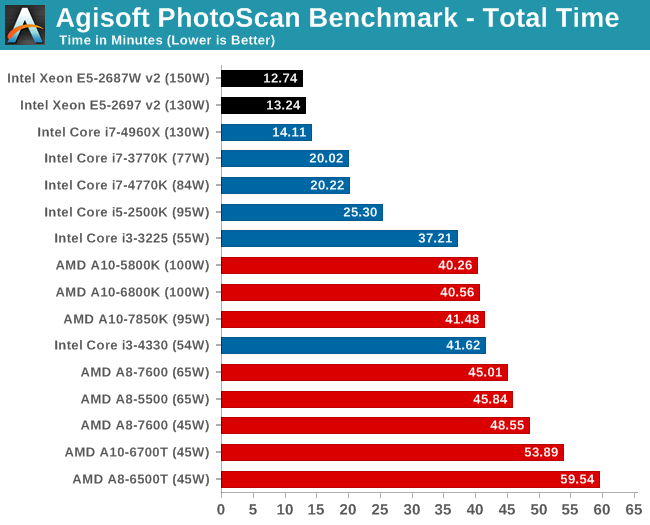
For PhotoScan, the extra cores and MHz from the Xeons means most in the first stage of the computation. The second stage shows an increas in CPU Mapping Speed, however this is the stage where the GPU can accelerate when in use. Stage 3 benefits more from the MHz of the 8-core model, and the final stage is about even.
Console Emulation –Dolphin Benchmark: link
At the start of 2014 I was emailed with a link to a new emulation benchmark based on the Dolphin Emulator. The issue with emulators tends to be two-fold: game licensing and raw CPU power required for the emulation. As a result, many emulators are often bound by single thread CPU performance, and general reports tended to suggest that Haswell provided a significant boost to emulator performance. This benchmark runs a Wii program that raytraces a complex 3D scene inside the Dolphin Wii emulator. Performance on this benchmark is a good proxy of the speed of Dolphin CPU emulation, which is an intensive single core task using most aspects of a CPU. Results are given in minutes, where the Wii itself scores 17.53; meaning that anything above this is faster than an actual Wii for processing Wii code, albeit emulated.
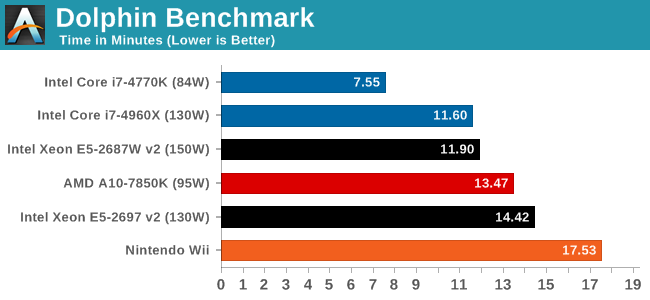
Emulation is a pure single threaded affair, and the IPC improvements of Haswell stand out a lot against the Ivy Bridge-E based Xeons.
Point Calculations – 3D Movement Algorithm Test: link
3DPM is a self-penned benchmark, taking basic 3D movement algorithms used in Brownian Motion simulations and testing them for speed. High floating point performance, MHz and IPC wins in the single thread version, whereas the multithread version has to handle the threads and loves more cores.
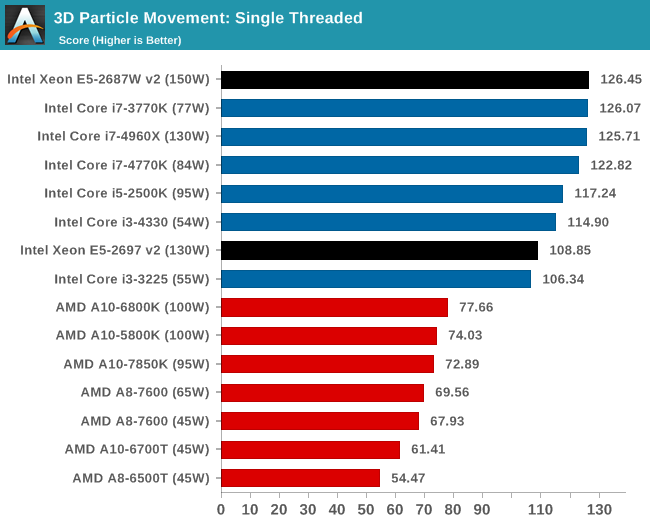
The low core frequency of the 12-core Xeon puts it behind in our FP single threaded benchmark.
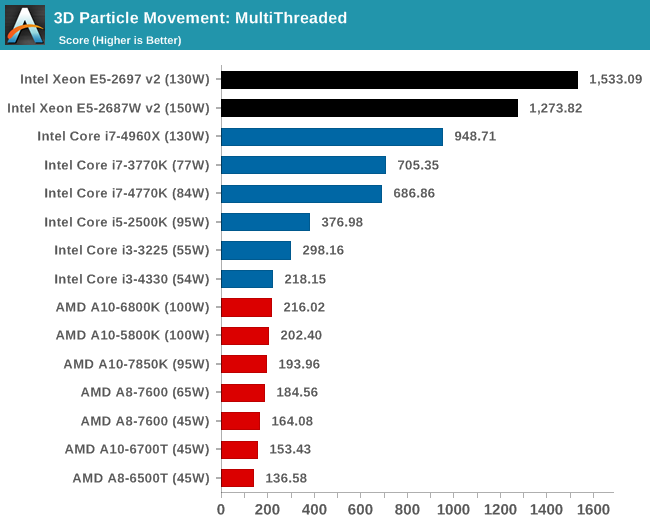
In out multithreaded scenario, we see the situation similar to PovRay, where cores and frequency take top spots.
Encryption –TrueCrypt v0.7.1a: link
TrueCrypt is an off the shelf open source encryption tool for files and folders. For our test we run the benchmark mode using a 1GB buffer and take the mean result from AES encryption.

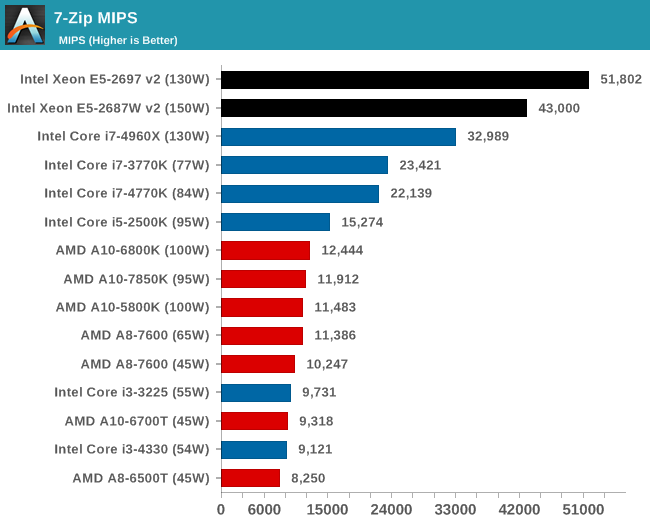
Synthetic – 7-Zip 9.2: link
As an open source compression tool, 7-Zip is a popular tool for making sets of files easier to handle and transfer. The software offers up its own benchmark, to which we report the result.
For our gaming benchmarks we brought in the MSI X79A-GD45 for some three-way GPU action, as the original GIGABYTE motherboard is limited beyond two GPUs. For the Xeons in our tests, the PCIe arrangement gave x16 in single GPU mode, x16/x16 in dual GPU mode and x16/x16/x8 in tri-GPU mode.
F1 2013
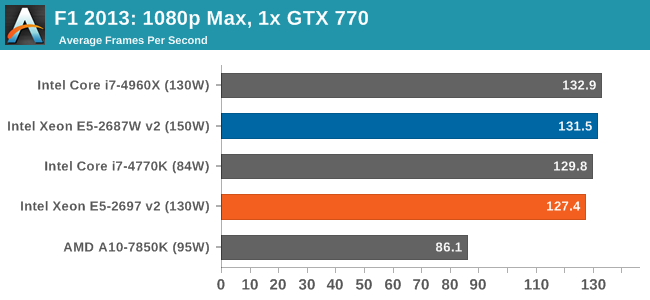
First up is F1 2013 by Codemasters. I am a big Formula 1 fan in my spare time, and nothing makes me happier than carving up the field in a Caterham, waving to the Red Bulls as I drive by (because I play on easy and take shortcuts). F1 2013 uses the EGO Engine, and like other Codemasters games ends up being very playable on old hardware quite easily. In order to beef up the benchmark a bit, we devised the following scenario for the benchmark mode: one lap of Spa-Francorchamps in the heavy wet, the benchmark follows Jenson Button in the McLaren who starts on the grid in 22nd place, with the field made up of 11 Williams cars, 5 Marussia and 5 Caterham in that order. This puts emphasis on the CPU to handle the AI in the wet, and allows for a good amount of overtaking during the automated benchmark. We test at 1920x1080 on Ultra graphical settings for a single GPU, as using multiple GPUs seems to have no scaling effect.

| F1 2013, 1080p Max | ||
| NVIDIA | AMD | |
| Average Frame Rates |
|
|
| Minimum Frame Rates |
|
|
While the higher frequency of the E5-2687W v2 puts it ahead of the 12-core Xeon, in each of our data points, except 3x HD7970, the Core i7-4960X gets the better frame rates.
Bioshock Infinite
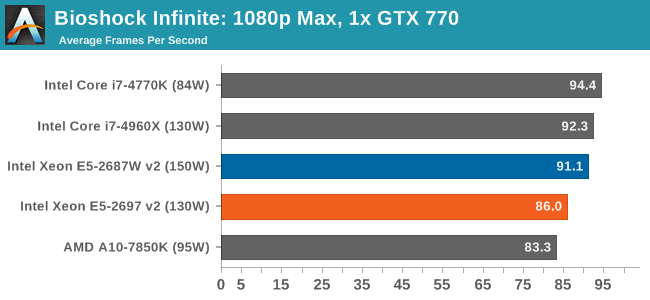
Bioshock Infinite was Zero Punctuation’s Game of the Year for 2013, uses the Unreal Engine 3, and is designed to scale with both cores and graphical prowess. We test the benchmark using the Adrenaline benchmark tool and the Xtreme (1920x1080, Maximum) performance setting, noting down the average frame rates and the minimum frame rates.

| Bioshock Infinite, 1080p Max | ||
| NVIDIA | AMD | |
| Average Frame Rates |
|
|
| Minimum Frame Rates |
|
|
Again, the 8-core higher frequency Xeon is faster than the 12-core Xeon in most of our tests, however the i7-4960X beats them most of the time. For certain arrangements, such as 2x HD7970, the Xeons lose slightly to the i7-4770K, most likely due to CPU IPC. However as the difference is only a couple of frames per second out of 130, this should not make much difference.
Tomb Raider
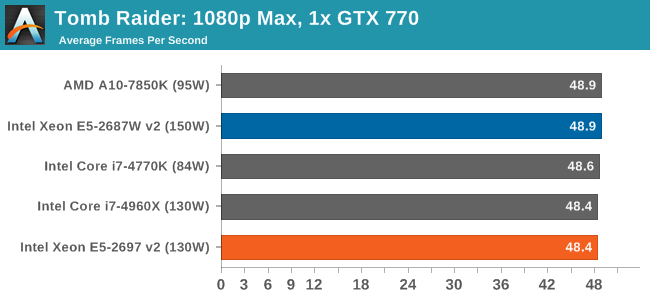
The next benchmark in our test is Tomb Raider. Tomb Raider is an AMD optimized game, lauded for its use of TressFX creating dynamic hair to increase the immersion in game. Tomb Raider uses a modified version of the Crystal Engine, and enjoys raw horsepower. We test the benchmark using the Adrenaline benchmark tool and the Xtreme (1920x1080, Maximum) performance setting, noting down the average frame rates and the minimum frame rates.

| Tomb Raider, 1080p Max | ||
| NVIDIA | AMD | |
| Average Frame Rates |
|
|
| Minimum Frame Rates |
|
|
In all the Tomb Raider tests, all the CPUs perform similarly, making Tomb Raider a seemingly agnostic test to CPU power.
Sleeping Dogs
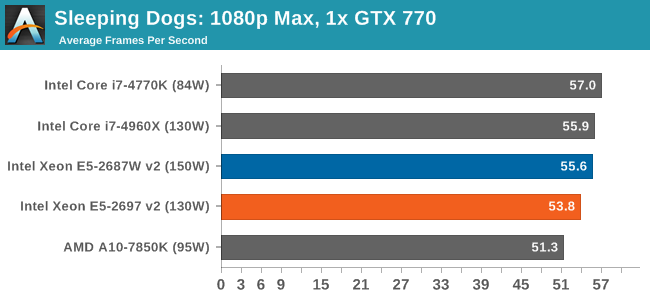
Sleeping Dogs is a benchmarking wet dream – a highly complex benchmark that can bring the toughest setup and high resolutions down into single figures. Having an extreme SSAO setting can do that, but at the right settings Sleeping Dogs is highly playable and enjoyable. We run the basic benchmark program laid out in the Adrenaline benchmark tool, and the Xtreme (1920x1080, Maximum) performance setting, noting down the average frame rates and the minimum frame rates.

| Sleeping Dogs, 1080p Max | ||
| NVIDIA | AMD | |
| Average Frame Rates |
|
|
| Minimum Frame Rates |
|
|
The lower frequency of the 12-core Xeon sometimes puts it behind in our Sleeping Dogs testing, usually in multiple GPU results such as 3x HD 7970 where it is 15 FPS behind both the i7-4960X and E5-2687W v2
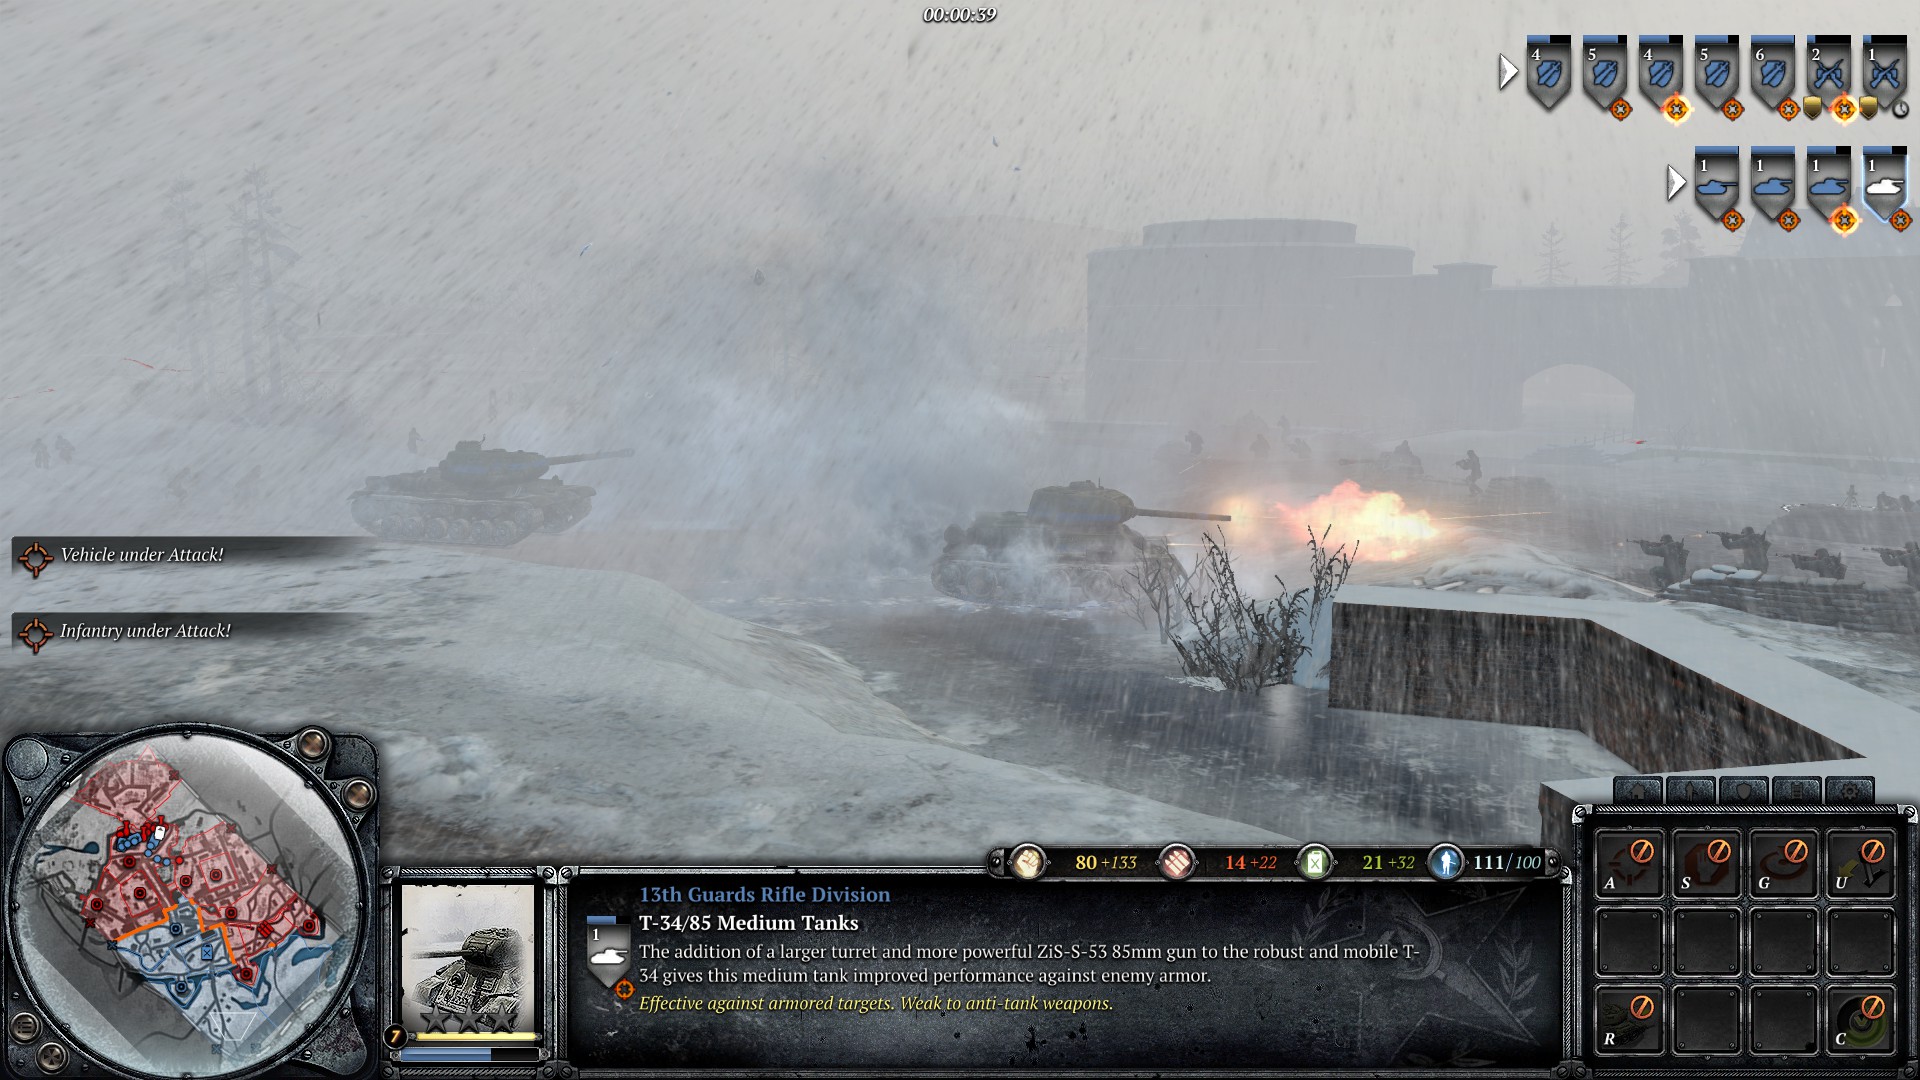
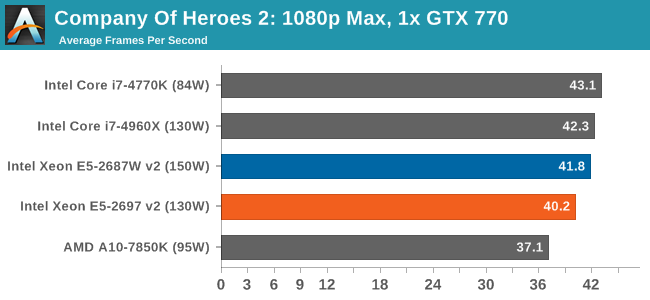
Company of Heroes 2
The final gaming benchmark is another humdinger. Company of Heroes 2 also can bring a top end GPU to its knees, even at very basic benchmark settings. To get an average 30 FPS using a normal GPU is a challenge, let alone a minimum frame rate of 30 FPS. For this benchmark I use modified versions of Ryan’s batch files at 1920x1080 on Medium. COH2 is a little odd in that it does not scale with more GPUs.
| Company of Heroes 2, 1080p Max | ||
| NVIDIA | AMD | |
| Average Frame Rates |
|
|
| Minimum Frame Rates |
|
|
COH2 also acts somewhat CPU agnostic, although the higher frequency Xeon does have a small negligable boost over the E5-2697 v2. In all circumstances, the i7-4960X is competitive.
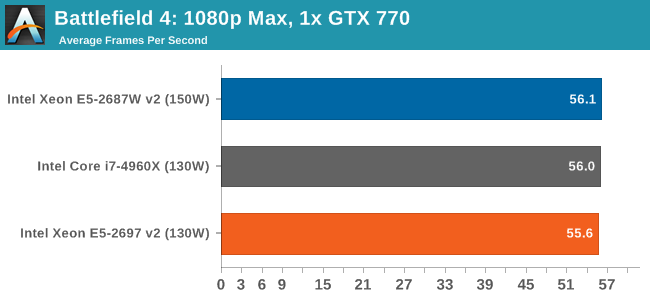
Battlefield 4
The EA/DICE series that has taken countless hours of my life away is back for another iteration, using the Frostbite 3 engine. AMD is also piling its resources into BF4 with the new Mantle API for developers, designed to cut the time required for the CPU to dispatch commands to the graphical sub-system. For our test we use the in-game benchmarking tools and record the frame time for the first ~70 seconds of the Tashgar single player mission, which is an on-rails generation of and rendering of objects and textures. We test at 1920x1080 at Ultra settings.
| Battlefield 4, 1080p Max | ||
| NVIDIA | AMD | |
| Average Frame Rates |
|
|
| 99th Percentile Frame Rates |
|
|
As we add more GPUs, AMD and NVIDIA act differently. With NVIDIA, more MHz gets better frame rates, whereas with AMD more cores wins out.
Conclusions
It would seem that in our gaming benchmarks, the higher frequency E5-2697W v2 is the more obvious choice over the 12-core E5-2697 v2. However in almost all circumstances, they perform on part with or below the i7-4960X, thus suggesting that our games tested cannot take advantage of more threads.
The nearest equivalent of the Core i7-4960X in the enterprise lineup is the Xeon E5-1660 V2. In terms of my testing at AnandTech, the i7-4960X represents the standard enthusiast processor that blitzes our benchmarks, and thus an opportunity to test something potentially faster is always welcome.
At the ultra-high-end of any CPU range, we can see a fight for cores against MHz to remain within the thermal design power limitations. Users can spend their money on more cores, which benefits parallel computation, or focus purely on MHz for single-threaded throughput. The downside of moving to higher MHz is usually efficiency, so the gains might not be as linear as expected.
This review tested two of the high end Intel E5-26xx processors – the 12-core 130W E5-2697 v2 and the 8-core 150W E5-2687W v2. The former is also the 12-core representative in the late 2013 Mac Pro, whereas the latter is the highest TDP processor that Intel makes in this segment. A few other CPUs share this honor, although they are part of the Ivy Bridge-EX E7-x8xx line. My goal was to find out where these two CPUs stand in what I consider ‘an enthusiast user’s scenario’, and as such we used the same benchmarks as in the AMD Kaveri launch article, involving gaming, compression, rendering, video conversion and 2D image to 3D modeling creation. Johan has dealt extensively on the enterprise server and high performance computing aspect of similar CPUs, and his deep dive into the functionality is worth a read if you have not already seen it.
Intel E5-2697 v2 - 12C/24T, 2.7 GHz (3.5 GHz Turbo), 130W
This processor is the most expensive E5-26xx CPU you can purchase, tipping the scales at $2614 (Intel price), but is expandable into dual socket systems. For the green we get 12-cores at a max loading of 3.0 GHz (base frequency + 3 turbo bins), which for most purposes should blitz through any multithreaded workload we can throw at it. The benchmarks tell the story, particularly when it comes to PovRay and the multi-threaded version of 3D Particle Movement – anything that can be subdivided up with no overhead benefits greatly from more cores over more MHz. But looking at other software that cannot take advantage of all the cores (Xilisoft seems to only use half cores on a single file at low resolution) then a processor with more MHz under the hood becomes the right choice.
Unfortunately anything over 6-core loading reduces it down to that lower 3.0 GHz mark, whereas single threaded speed is up at 3.5 GHz. Ultimately it is up to the motherboard to implement which turbo modes and P states are in use, and on the consumer line we often find motherboards using a form of ‘MultiCore Turbo’ (read our explanation here). If the E5-2697 v2 was put in this position, we would have 12 cores at 3.5 GHz, ready to blast through the workload.
At this level of single socket production, the price might seem outrageous to home users. However if we consider a workstation scenario (such as rendering at the office) which requires 256GB of DRAM and a beefy CPU, then the DRAM can easily be half the cost of the system – or even the software license can outstrip that. The E5-2697 v2 is the king of the 12-core Intel CPUs in the E5-26xx space. It makes me want to see the Haswell-E versions as soon as possible to see where we stand.
Intel E5-2687W v2 - 8C/16T, 3.4 GHz (4.0 GHz Turbo), 150W
At some point in the socketed processor space, we have to consider ‘what is the absolute thermal limit of a processor?’ Over the last couple of decades we have seen it rise from 20W to 40W, 95W, 115W, 130W, 150W and if we glance sideways to AMD, even 220W seems to be on the cards. The increase of power consumption is from more cores, more frequency and more voltage – as the high end is pushed, efficiency drops and we need more power to get a smaller increase in performance. However there are users who would pay for that extra 100 MHz all the time. This is why the E5-2687W exists – it is simply the 8 core version of the i7-4960X at the same clock speeds. But the power consumption for 33% more cores is actually only 15%, because Intel tightens up the frequency/voltage characteristics for these models.
While the E5-2687W v2 performs almost identical to the i7-4960X at single thread benchmarks, and then beats it in the variable-threaded scenario, it does come at a 2X cost. A user with an i7-4930K could argue that with a small overclock, their purchase could be up to 4X the value. But again, part of the added cost comes in the Xeon features – memory support, 2P system compatibility, virtualization and so forth.
I would actually go ahead and say that Intel has kind of shot themselves in the foot with this processor. The reason for this comment is based on another model in the product stack, the E5-2667 v2. If I line them up side by side, it should become obvious why:
| Intel E5 SKU Comparison | ||
| Xeon E5-2687W v2 | Xeon E5-2667 v2 | |
| Release Date | September 10th, 2013 | |
| Cores | 8 | |
| Threads | 16 | |
| Base Frequency | 3400 | 3300 |
| Frequency 1C | 4000 | |
| Frequency 2C | 3900 | |
| Frequency 3C | 3800 | |
| Frequency 4C | 3700 | |
| Frequency 5C | 3600 | |
| Frequency 6C | 3600 | |
| Frequency 7C | 3600 | |
| Frequency 8C | 3600 | |
| L3 Cache | 25MB | |
| Max TDP | 150W | 130W |
| Max Memory Size | 256 GB | 768 GB |
| Memory Channels | 4 | |
| Memory Frequency | DDR3-1866 | |
| PCIe Revision | 3.0 | |
| PCIe Lanes | 40 | |
| Multi-Processor | 2P | |
| VT-x | Yes | |
| VT-d | Yes | |
| TSX-NI | Yes | |
| Memory Bandwidth | 59.7 GB/s | |
| Price (Newegg) | $2108 | $2057 |
The E5-2667 v2 is the same speed at any core loading as the E5-2687W v2, the same cache, the same features, except it is slightly cheaper, uses less power and supports more memory. Sounds like an easy win for the E5-2667 v2.
Unfortunately I could not find the E5-2667 v2 for sale as easily as the E5-2687W v2. The sole UK retailer I found with an E5-2667 v2 was not one I was familiar with; however Newegg will sell you the E5-2687W v2 for $2200. This feeds back into another issue with Intel’s SKU policy – only certain SKUs will be sold direct to the public, while others might go only to OEMs and system integrators, like SuperMicro, Dell, HP and so on. We find this issue on the LGA1150 Xeons as well, where the low power SKUs like the Xeon E3-1230L v3 are not on general release. An ideal solution for this would be for Intel to sell direct to the consumer, rather than regional sales offices deciding which models each region needs (and thus limiting our selection).


