Original Link: https://www.anandtech.com/show/7480/ocz-vector-150-120gb-240gb-review
OCZ Vector 150 (120GB & 240GB) Review
by Kristian Vättö on November 7, 2013 9:00 AM EST- Posted in
- Storage
- SSDs
- OCZ
- Indilinx
- Vector 150
The shopping season is getting busier and busier as we get closer to the holidays. This is a season that no manufacturer wants to miss because statistically speaking the holiday season accounts for about one fifth of all the retail sales in the US. It's no coincidence that we also see a ton of product releases before the holiday shopping season or right at the beginning of it. For manufacturers it's crucial to have a competitive and up-to-date lineup because no company wants to miss the chance of generating potentially over 20% of their annual revenue.
The SSD market is no exception to the rule. While an SSD may not be the first gift idea to come to your mind, the shipments increase temporarily in Q4 where the holiday shopping season falls. There's even some actual data from a research firm IHS.
| Worldwide SSD Shipments | |||||
| Q1'12 | Q2'12 | Q3'12 | Q4'12 | Q1'13 | |
| Units (in Millions) | 6.0 | 7.3 | 9.3 | 12.1 | 11.5 |
Part of the reason for the increase is of course the increased sales of PCs, of which some come with a pre-installed SSD. However, the increase is not limited to PC sales as the holiday season is also a busy time for new builds and upgrading existing computers, both of which impact the retail SSD market.
OCZ's answer to the holiday demand is the Vector 150. Like the original Vector and Vertex 450, the Vector 150 is based on OCZ's first fully in-house designed Barefoot 3 controller. OCZ hasn't given out much specifics about the controller other than it's an 8-channel design with two cores (one unnamed ARM Cortex core and OCZ Aragon co-processor). The only change in hardware this round is the switch from 25nm IMFT MLC NAND to Toshiba's 19nm MLC NAND. Toshiba announced the production of second generation 19nm NAND in May but the Vector 150 is using the first generation 19nm NAND. I will however save the details of the differences between Toshiba's first and second generation NAND for a review where we have a drive with the second generation NAND.
The change in NAND makes perfect sense because 25nm NAND hasn't been cost effective for a long time and the 19nm/20nm processes have matured enough to meet the criteria for a high-end SSDs. I believe OCZ went with Toshiba's NAND for performance reasons because generally Toshiba's NAND has been a bit faster than IMFT's. Back when OCZ released the Vertex 450, I asked them why didn't they just release an updated Vector with 20nm IMFT NAND. OCZ told me that the 20nm NAND didn't meet their performance standards for a high-end SSD and hence they released the mainstream orientated Vertex 450 and kept using IMFT's 25nm NAND in the Vector. (In case you didn't already know, Vector is OCZ's enthusiast orientated brand, whereas the Vertex is more mainstream focused.) I put down a quick table comparing the differences between the three Barefoot 3 based SSDs that OCZ has in their product portfolio.
| Comparison of OCZ's Barefoot 3 Based SSDs | |||
| Vector 150 | Vector | Vertex 450 | |
| Controller | Indilinx Barefoot 3 | ||
| NAND | 19nm Toshiba | 25nm IMFT | 20nm IMFT |
| Encryption | AES-256 | N/A | AES-256 |
| Endurance | 50GB/day for 5 years | 20GB/day for 5 years | 20GB/day for 3 years |
| Warranty | 5 years | 5 years | 3 years |
There are obviously some performance differences too but since those vary depending on the capacity, I decided to leave them out to keep the table readable. The Vector 150 has two major upgrades over the original Vector: Hardware encryption support and higher endurance. Unlike the original Vector, the Vector 150 (as well as the Vertex 450) supports AES-256 hardware encryption. Unfortunately OCZ's implementation does not support TCG Opal 2.0 and IEEE-1667 specs, so it's not compatible with Windows 8's hardware accelerated BitLocker. The lack of TCG Opal 2.0 support also means that there is no support for encryption software such as Wave and WinMagic, which support hardware accelerated encryption similar to Windows 8's BitLocker. I think more manufacturers should implement these specifications as it makes encrypting a drive much easier with no impact on performance that comes from software implemented encryption. Encryption via ATA password is way more complicated for the end-user and it's also more vulnerable.
The 2.5x increase in endurance is pretty impressive especially when taking into account that we're dealing with smaller lithography NAND with lower endurance. OCZ has achieved the higher endurance with a combination of three things: Advanced flash management and more validation and over-provisioning. OCZ didn't want to go into details about their flash management technologies, which isn't surprising as those technologies tend to be proprietary. However, I would expect at least some sort of adaptive DSP to extend the life of the NAND. Increasing the amount of over-provisioning will lower the write amplification, which in turn will reduce NAND writes and allow for more host writes. As you can see in the table below, OCZ has switched to ~12% stock over-provisioning similar to Corsair's Neutron and SandForce drives.
The final part in the endurance equation is validation. In a perfect world you would just multiply the NAND's P/E cycles with the NAND's capacity to get endurance but unfortunately it's not that simple. You do get the NAND endurance with that equation but there are other parts that need to be taken into account. Validation has to take all potential causes of failure (such as voltage regulators) into account, so the endurance number is a result of the manufacturer's internal validation process. It's an expensive and time consuming process because what you are basically doing is taking hundreds or even thousands of drives and testing them in various environments by writing to them until they die.
It's good to keep in mind that the endurance rating is usually based on a 4KB random write workload, so your NAND writes may end up being way more than 50GB a day. One of the biggest reasons why manufacturers have to limit the warranty with an endurance rating is because otherwise enterprises could use much cheaper consumer SSDs and use the warranty as a basis of getting the drive replaced once they've worn it out. The manufacturers want the enterprise customers to pay the premium for their enterprise SSDs since they've invested on the extra validation required by the enterprise market and it's a market that tends to have higher profits as well.
Update: We're now fairly convinced that the death of our first Vector 150 sample was a result of our power analysis harness and not the fault of the drive/firmware itself. Our second Vector 150 sample has been running flawlessly since receipt.
| OCZ Vector 150 Specifications | |||
| 120GB | 240GB | 480GB | |
| Controller | Indilinx Barefoot 3 | ||
| NAND | 19nm Toshiba MLC | ||
| DRAM Cache | 512MB | 512MB | 1GB |
| Sequential Read | 550MB/s | 550MB/s | 550MB/s |
| Sequential Write | 450MB/s | 530MB/s | 530MB/s |
| 4KB Random Read | 80K IOPS | 90K IOPS | 100K IOPS |
| 4KB Random Write | 95K IOPS | 95K IOPS | 95K IOPS |
| Steady-state 4KB Random Write | 12K IOPS | 21K IOPS | 26K IOPS |
| Power Consumption | 0.55W Idle / 2.5W Active | ||
| Warranty | 5 years or 91TB of writes | ||
The Vector 150 doesn't support Windows 8's DevSleep functionality, hence the idle power consumption is fairly high. In my opinion it's a bit of let down because most of the high-end SSDs are able to get into very low power states while idle, which results in longer battery life for portable computers. For comparison Samsung's SSD 840 Pro draws only 36.6 milliwatts while idle with HIPM and DIPM enabled, so the difference is over tenfold.
It's also good to see OCZ reporting steady-state random write numbers. The peak numbers are only meaningful if you're dealing with an empty drive and hence it's good that manufacturers are being more open about the performance when dealing with a heavily used drive. I hope more manufacturers will follow suit and start including steady-state numbers as a part of the product specifcations.
As I described above, the 5-year warranty has an endurance condition. The warranty is 5 years or 91TB of writes, whatever comes first. The 91TB figure is derived from 50GB of writes per day (50GB x 365 x 5) and it's the same for all capacities. OCZ did tell me that they're willing to look into individual cases in case the drive dies after 95TB of writes for example but users who will be writing more than 50GB a day should still look into enterprise solutions.
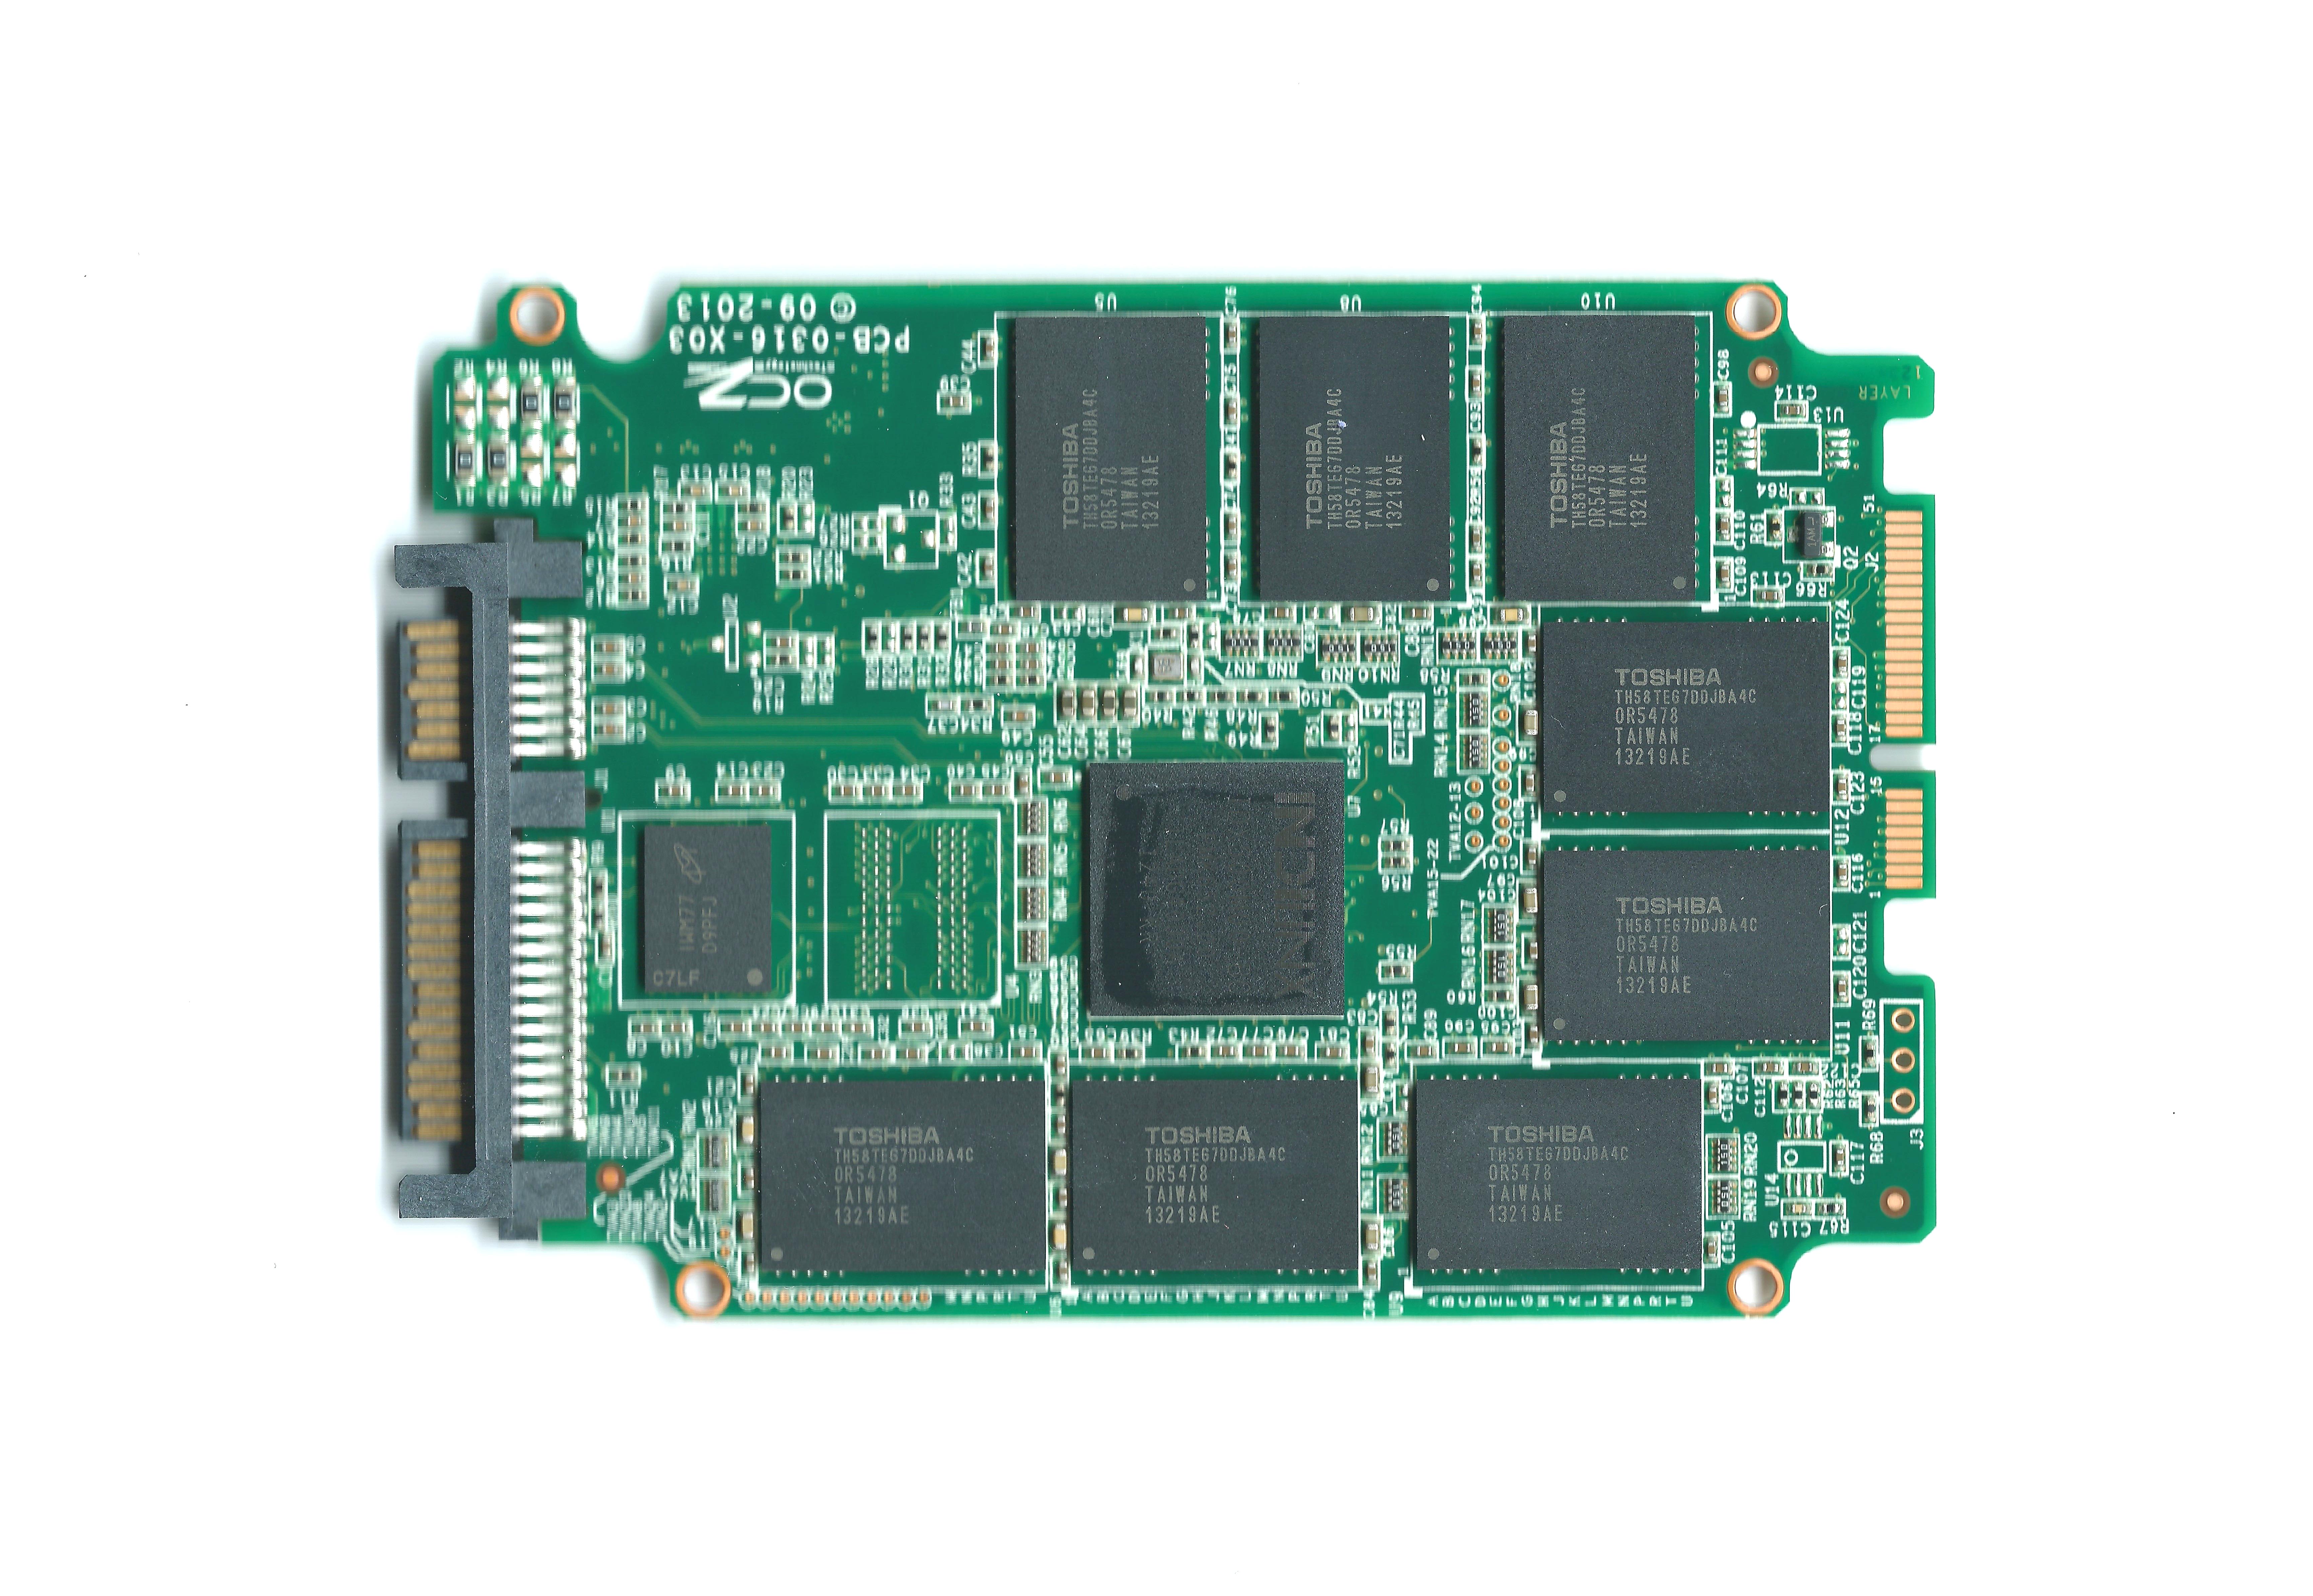
With the original Vector OCZ bought NAND in wafers from Micron and did their own validation and packaging. With the Vector 150 (and Vertex 450) that has changed and OCZ uses pre-packaged NAND from Toshiba. I believe NAND OEMs aren't very willing to sell their latest generation NAND in wafers because they know the profit margins are much better with pre-packaged NAND and with limited supply the clients don't have very many options. There's a total of 16 NAND packages (2x8GB each), eight on each side of the PCB. There are also two Micron 256MB DDR3-1600 chips working as a cache.
Test System
| CPU | Intel Core i5-2500K running at 3.3GHz (Turbo and EIST enabled) |
| Motherboard | AsRock Z68 Pro3 |
| Chipset | Intel Z68 |
| Chipset Drivers | Intel 9.1.1.1015 + Intel RST 10.2 |
| Memory | G.Skill RipjawsX DDR3-1600 4 x 8GB (9-9-9-24) |
| Video Card |
XFX AMD Radeon HD 6850 XXX (800MHz core clock; 4.2GHz GDDR5 effective) |
| Video Drivers | AMD Catalyst 10.1 |
| Desktop Resolution | 1920 x 1080 |
| OS | Windows 7 x64 |
Thanks to G.Skill for the RipjawsX 32GB DDR3 DRAM kit
Performance Consistency
In our Intel SSD DC S3700 review Anand introduced a new method of characterizing performance: looking at the latency of individual operations over time. The S3700 promised a level of performance consistency that was unmatched in the industry, and as a result needed some additional testing to show that. The reason we don't have consistent IO latency with SSDs is because inevitably all controllers have to do some amount of defragmentation or garbage collection in order to continue operating at high speeds. When and how an SSD decides to run its defrag and cleanup routines directly impacts the user experience. Frequent (borderline aggressive) cleanup generally results in more stable performance, while delaying that can result in higher peak performance at the expense of much lower worst-case performance. The graphs below tell us a lot about the architecture of these SSDs and how they handle internal defragmentation.
To generate the data below we take a freshly secure erased SSD and fill it with sequential data. This ensures that all user accessible LBAs have data associated with them. Next we kick off a 4KB random write workload across all LBAs at a queue depth of 32 using incompressible data. We run the test for just over half an hour, nowhere near what we run our steady state tests for but enough to give a good look at drive behavior once all spare area fills up.
We record instantaneous IOPS every second for the duration of the test and then plot IOPS vs. time and generate the scatter plots below. Each set of graphs features the same scale. The first two sets use a log scale for easy comparison, while the last set of graphs uses a linear scale that tops out at 40K IOPS for better visualization of differences between drives.
The high level testing methodology remains unchanged from our S3700 review. Unlike in previous reviews however, we vary the percentage of the drive that gets filled/tested depending on the amount of spare area we're trying to simulate. The buttons are labeled with the advertised user capacity had the SSD vendor decided to use that specific amount of spare area. If you want to replicate this on your own all you need to do is create a partition smaller than the total capacity of the drive and leave the remaining space unused to simulate a larger amount of spare area. The partitioning step isn't absolutely necessary in every case but it's an easy way to make sure you never exceed your allocated spare area. It's a good idea to do this from the start (e.g. secure erase, partition, then install Windows), but if you are working backwards you can always create the spare area partition, format it to TRIM it, then delete the partition. Finally, this method of creating spare area works on the drives we've tested here but not all controllers are guaranteed to behave the same way.
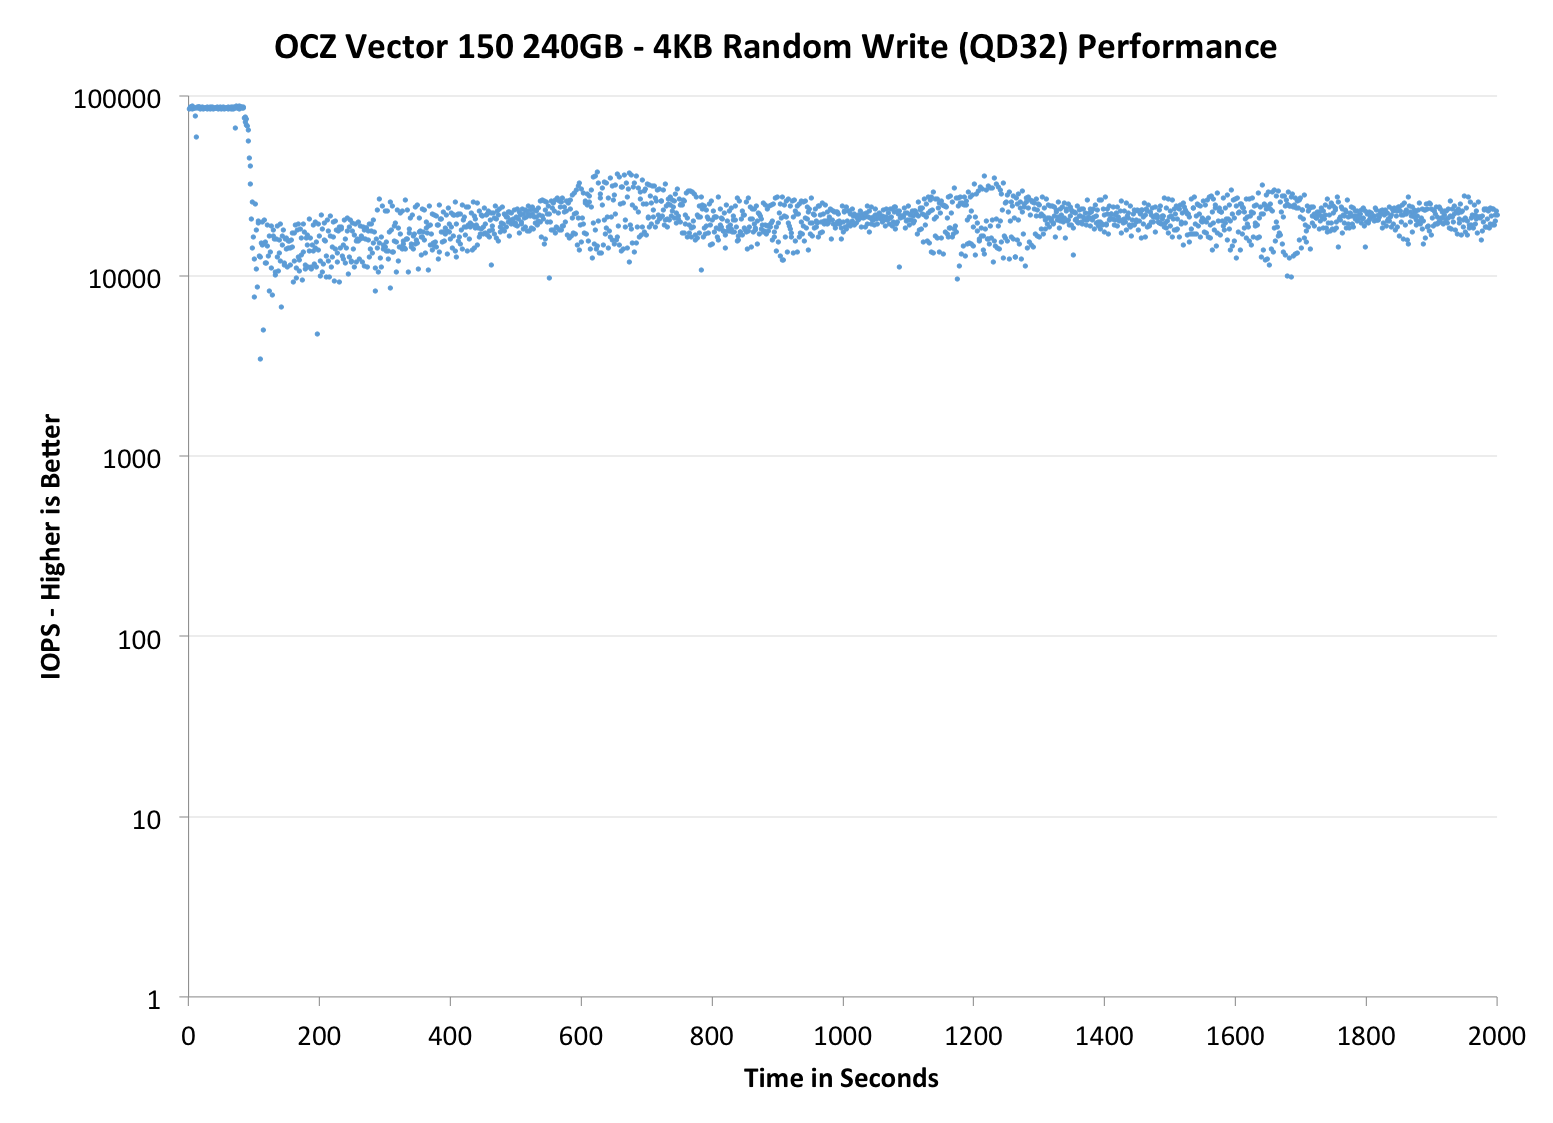
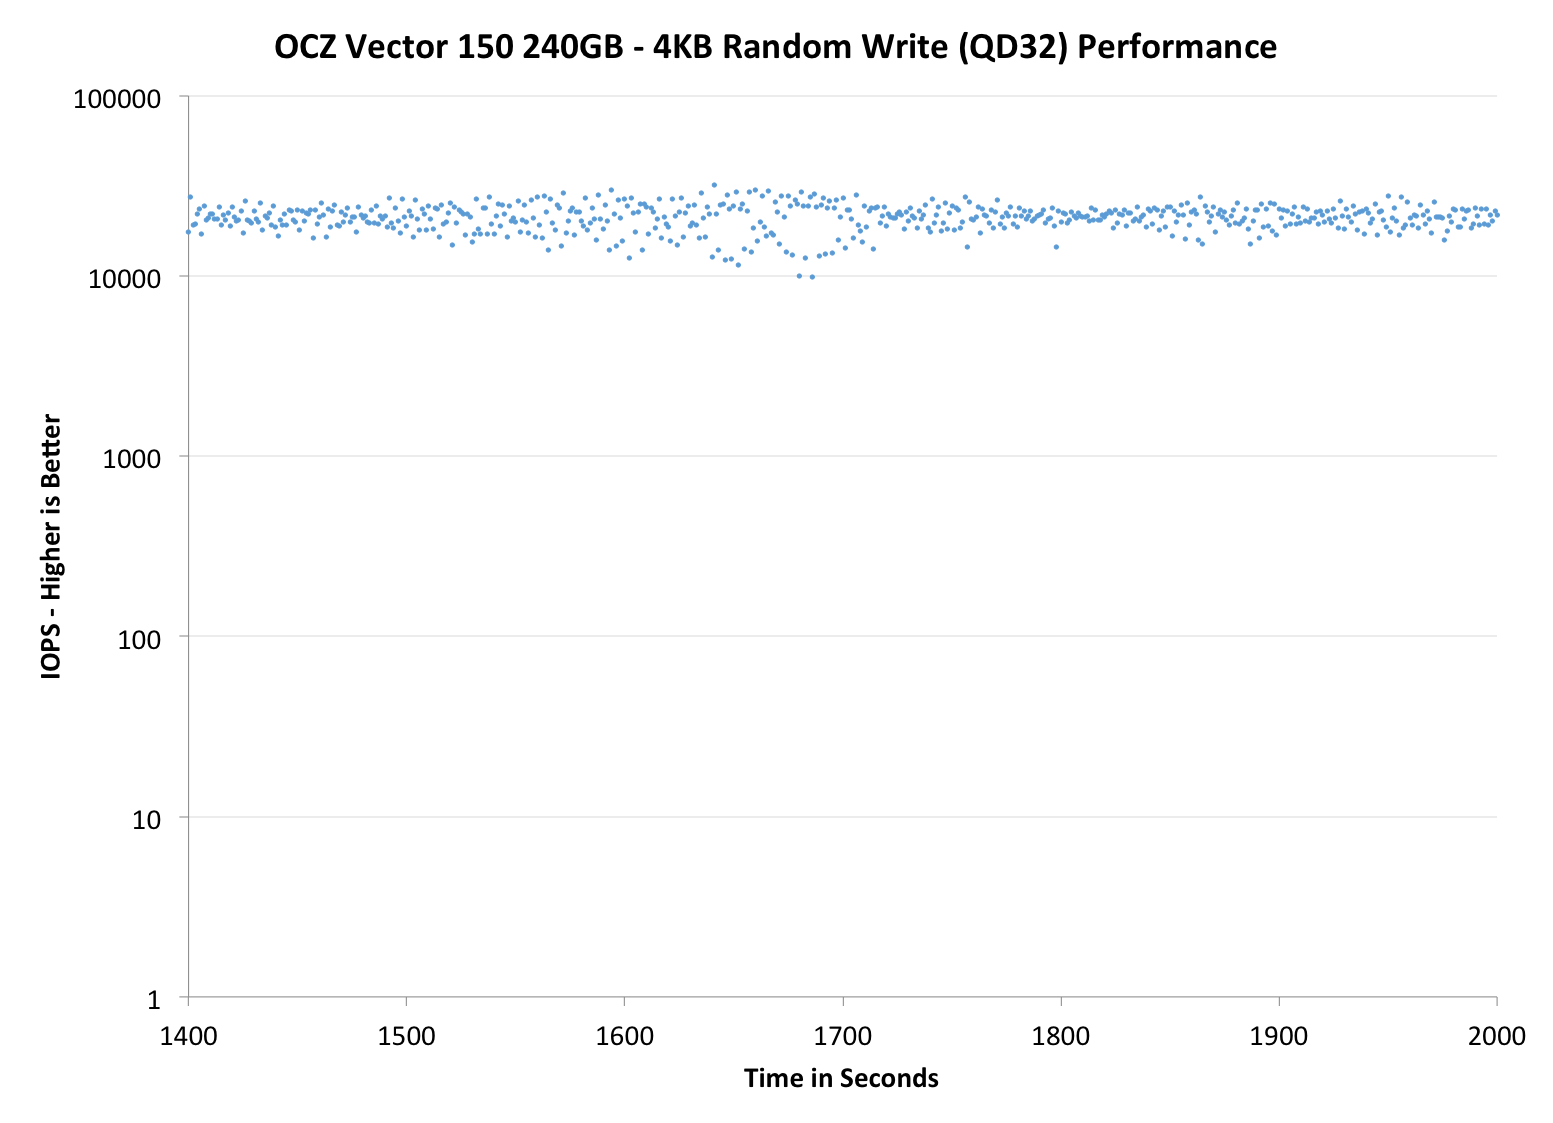
The first set of graphs shows the performance data over the entire 2000 second test period. In these charts you'll notice an early period of very high performance followed by a sharp dropoff. What you're seeing in that case is the drive allocating new blocks from its spare area, then eventually using up all free blocks and having to perform a read-modify-write for all subsequent writes (write amplification goes up, performance goes down).
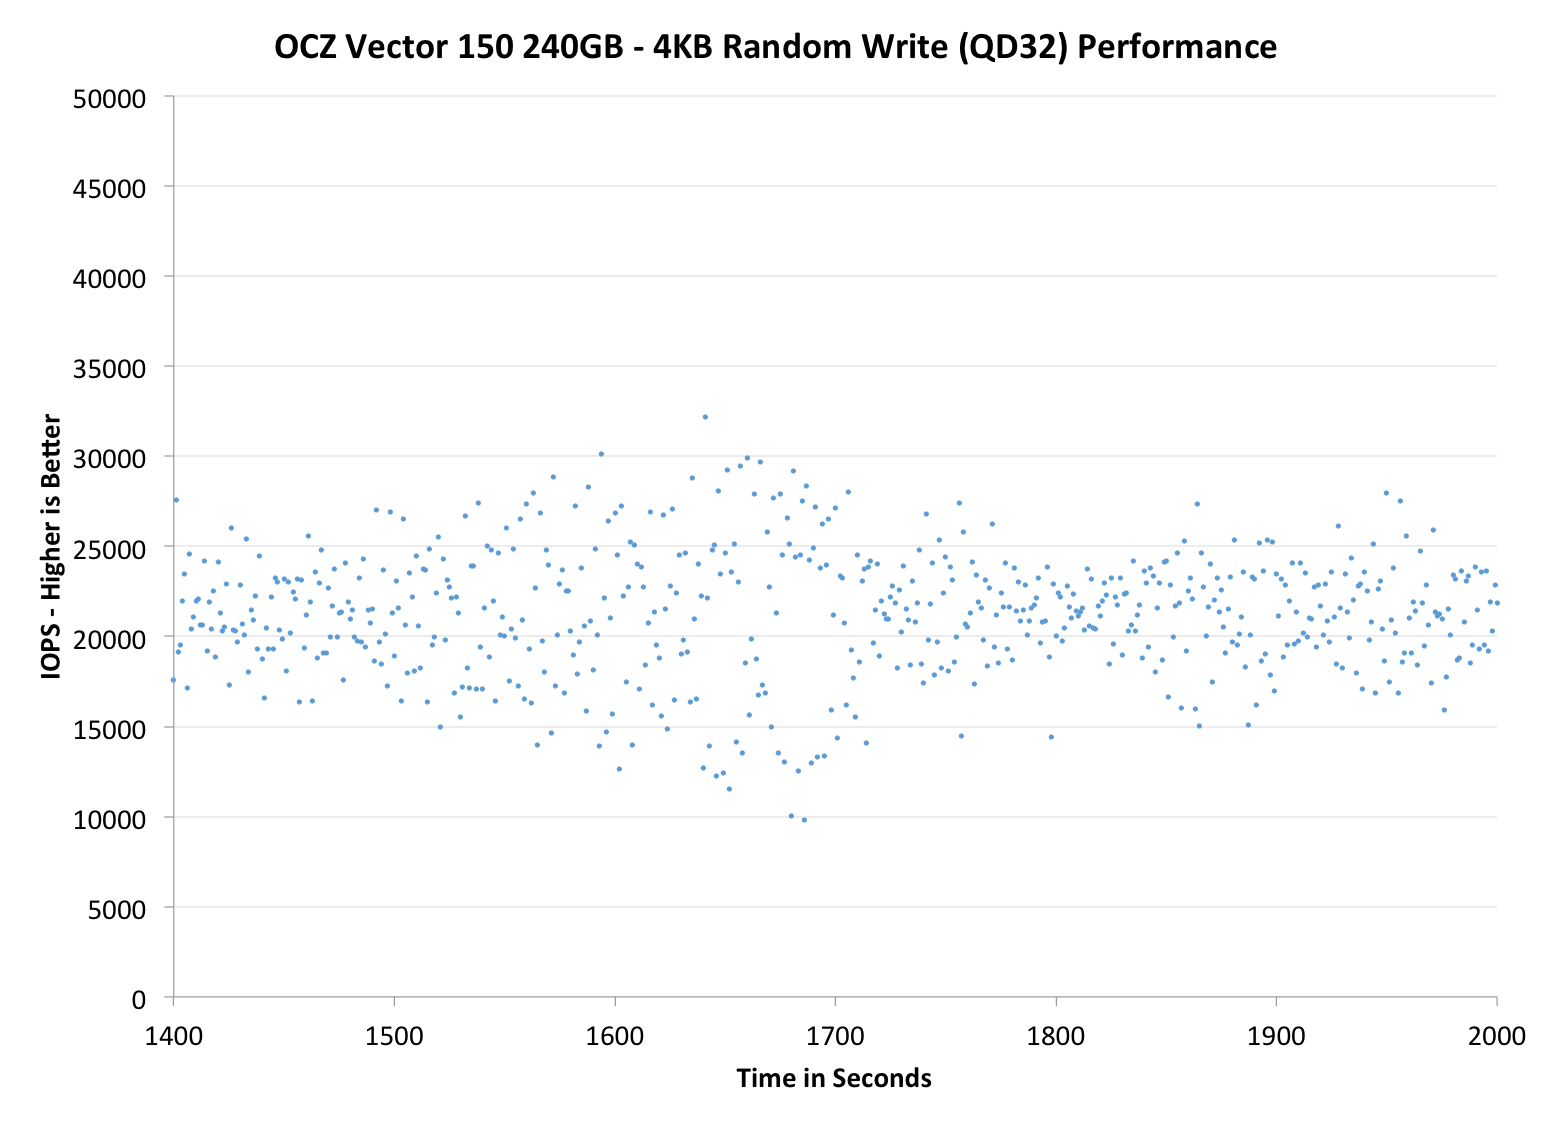
The second set of graphs zooms in to the beginning of steady state operation for the drive (t=1400s). The third set also looks at the beginning of steady state operation but on a linear performance scale. Click the buttons below each graph to switch source data.
 |
|||||||||
| OCZ Vector 150 240GB | OCZ Vector 256GB | Corsair Neutron 240GB | Sandisk Extreme II 480GB | Samsung SSD 840 Pro 256GB | |||||
| Default | |||||||||
| 25% OP | |||||||||
Performance consistency is simply outstanding. OCZ told us that they focused heavily on IO consistency in the Vector 150 and the results speak for themselves. Obviously the added over-provisioning helps but if you compare it to the Corsair Neutron with the same ~12% over-provisioning, the Vector 150 wins. The Neutron and other LAMD based SSDs have been one of the most consistent SSDs to date, so the Vector 150 beating the Neutron is certainly an honorable milestone for OCZ. However if you increase the over-provisioning to 25%, the Vector 150's advantage doesn't scale. In fact, the original Vector is slightly more consistent with 25% over-provisioning than the Vector 150 but both are definitely among the most consistent.
 |
|||||||||
| OCZ Vector 150 240GB | OCZ Vector 256GB | Corsair Neutron 240GB | SanDisk Extreme II 480GB | Samsung SSD 840 Pro 256GB | |||||
| Default | |||||||||
| 25% OP | |||||||||
 |
|||||||||
| OCZ Vector 150 240GB | OCZ Vector 256GB | Corsair Neutron 240GB | SanDisk Extreme II 480GB | Samsung SSD 840 Pro 256GB | |||||
| Default | |||||||||
| 25% OP | |||||||||
TRIM Validation
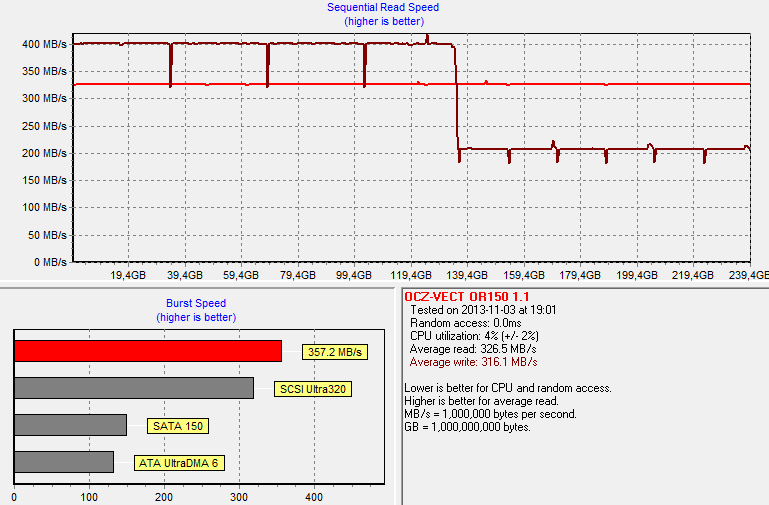
Above is an HD Tach graph I ran on a secure erased drive to get the baseline performance. The graph below is from a run that I ran after our performance consistency test (first filled with sequential data and then hammered with 4KB random writes at queue depth of 32 for 2000 seconds):
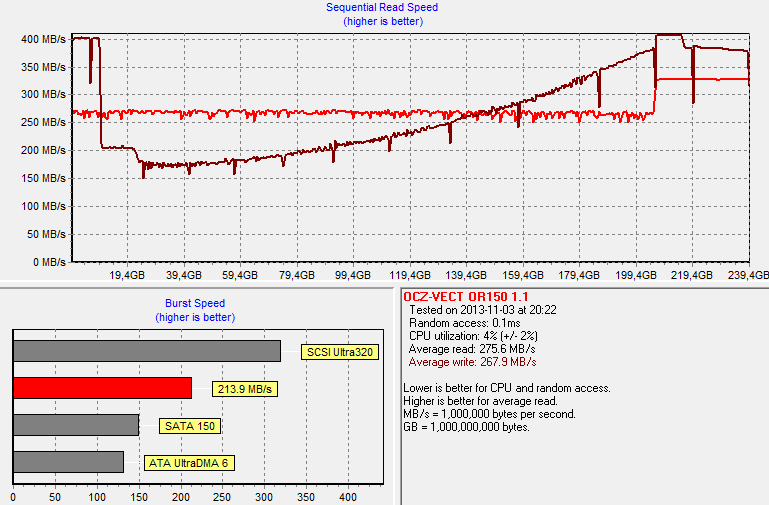
And as always, performance degrades, although the Vector 150 does pretty good with recovering the performance if you write sequential data to the drive. Finally I TRIM'ed the entire volume and reran HD Tach to make sure TRIM is functional.
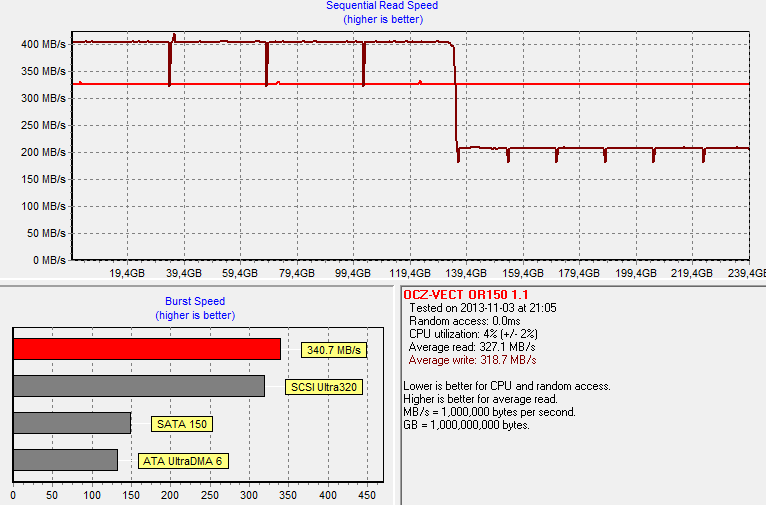
It is. You can also see the impact of OCZ's "performance mode" in the graphs. Once 50% of the LBAs have been filled, the drive will reorganize the data, which causes the performance degradation. If you leave the drive idling after filling over half of it, the performance will return close to brand new state within minutes. Our internal tests with the original Vector have shown that the data reorganization takes less than 10 minutes, so it's nothing to be concerned about. The HD Tach graphs give a much worse picture of the situation than it really is.
AnandTech Storage Bench 2013
When Anand built the AnandTech Heavy and Light Storage Bench suites in 2011 he did so because we didn't have any good tools at the time that would begin to stress a drive's garbage collection routines. Once all blocks have a sufficient number of used pages, all further writes will inevitably trigger some sort of garbage collection/block recycling algorithm. Our Heavy 2011 test in particular was designed to do just this. By hitting the test SSD with a large enough and write intensive enough workload, we could ensure that some amount of GC would happen.
There were a couple of issues with our 2011 tests that we've been wanting to rectify however. First off, all of our 2011 tests were built using Windows 7 x64 pre-SP1, which meant there were potentially some 4K alignment issues that wouldn't exist had we built the trace on a system with SP1. This didn't really impact most SSDs but it proved to be a problem with some hard drives. Secondly, and more recently, we've shifted focus from simply triggering GC routines to really looking at worst-case scenario performance after prolonged random IO.
For years we'd felt the negative impacts of inconsistent IO performance with all SSDs, but until the S3700 showed up we didn't think to actually measure and visualize IO consistency. The problem with our IO consistency tests is that they are very focused on 4KB random writes at high queue depths and full LBA spans—not exactly a real world client usage model. The aspects of SSD architecture that those tests stress however are very important, and none of our existing tests were doing a good job of quantifying that.
We needed an updated heavy test, one that dealt with an even larger set of data and one that somehow incorporated IO consistency into its metrics. We think we have that test. The new benchmark doesn't even have a name, we've just been calling it The Destroyer (although AnandTech Storage Bench 2013 is likely a better fit for PR reasons).
Everything about this new test is bigger and better. The test platform moves to Windows 8 Pro x64. The workload is far more realistic. Just as before, this is an application trace based test—we record all IO requests made to a test system, then play them back on the drive we're measuring and run statistical analysis on the drive's responses.
Imitating most modern benchmarks Anand crafted the Destroyer out of a series of scenarios. For this benchmark we focused heavily on Photo editing, Gaming, Virtualization, General Productivity, Video Playback and Application Development. Rough descriptions of the various scenarios are in the table below:
| AnandTech Storage Bench 2013 Preview -- The Destroyer | ||||||||||||
| Workload | Description | Applications Used | ||||||||||
| Photo Sync/Editing | Import images, edit, export | Adobe Photoshop CS6, Adobe Lightroom 4, Dropbox | ||||||||||
| Gaming | Download/install games, play games | Steam, Deus Ex, Skyrim, Starcraft 2, BioShock Infinite | ||||||||||
| Virtualization | Run/manage VM, use general apps inside VM | VirtualBox | ||||||||||
| General Productivity | Browse the web, manage local email, copy files, encrypt/decrypt files, backup system, download content, virus/malware scan | Chrome, IE10, Outlook, Windows 8, AxCrypt, uTorrent, AdAware | ||||||||||
| Video Playback | Copy and watch movies | Windows 8 | ||||||||||
| Application Development | Compile projects, check out code, download code samples | Visual Studio 2012 | ||||||||||
While some tasks remained independent, many were stitched together (e.g. system backups would take place while other scenarios were taking place). The overall stats give some justification to what we've been calling this test internally:
| AnandTech Storage Bench 2013 Preview -- The Destroyer, Specs | |||||||||||||
| The Destroyer (2013) | Heavy 2011 | ||||||||||||
| Reads | 38.83 million | 2.17 million | |||||||||||
| Writes | 10.98 million | 1.78 million | |||||||||||
| Total IO Operations | 49.8 million | 3.99 million | |||||||||||
| Total GB Read | 1583.02 GB | 48.63 GB | |||||||||||
| Total GB Written | 875.62 GB | 106.32 GB | |||||||||||
| Average Queue Depth | ~5.5 | ~4.6 | |||||||||||
| Focus | Worst-case multitasking, IO consistency | Peak IO, basic GC routines | |||||||||||
SSDs have grown in their performance abilities over the years, so we wanted a new test that could really push high queue depths at times. The average queue depth is still realistic for a client workload, but the Destroyer has some very demanding peaks. When we first introduced the Heavy 2011 test, some drives would take multiple hours to complete it; today most high performance SSDs can finish the test in under 90 minutes. The Destroyer? So far the fastest we've seen it go is 10 hours. Most high performance SSDs we've tested seem to need around 12—13 hours per run, with mainstream drives taking closer to 24 hours. The read/write balance is also a lot more realistic than in the Heavy 2011 test. Back in 2011 we just needed something that had a ton of writes so we could start separating the good from the bad. Now that the drives have matured, we felt a test that was a bit more balanced would be a better idea.
Despite the balance recalibration, there's just a ton of data moving around in this test. Ultimately the sheer volume of data here and the fact that there's a good amount of random IO courtesy of all of the multitasking (e.g. background VM work, background photo exports/syncs, etc...) makes the Destroyer do a far better job of giving credit for performance consistency than the old Heavy 2011 test. Both tests are valid; they just stress/showcase different things. As the days of begging for better random IO performance and basic GC intelligence are over, we wanted a test that would give us a bit more of what we're interested in these days. As Anand mentioned in the S3700 review, having good worst-case IO performance and consistency matters just as much to client users as it does to enterprise users.
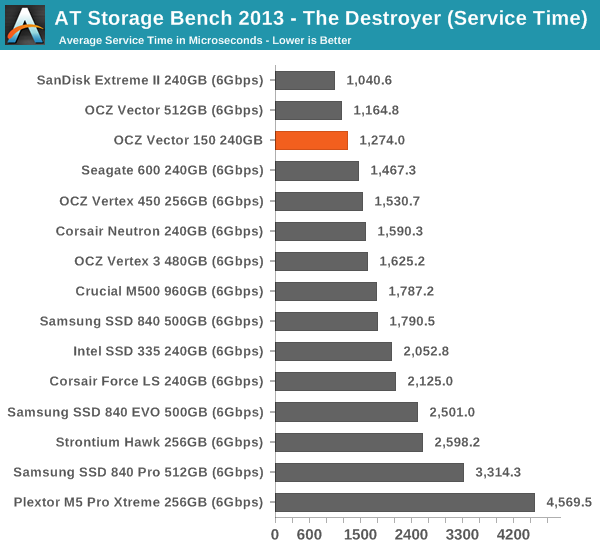
We're reporting two primary metrics with the Destroyer: average data rate in MB/s and average service time in microseconds. The former gives you an idea of the throughput of the drive during the time that it was running the Destroyer workload. This can be a very good indication of overall performance. What average data rate doesn't do a good job of is taking into account response time of very bursty (read: high queue depth) IO. By reporting average service time we heavily weigh latency for queued IOs. You'll note that this is a metric we've been reporting in our enterprise benchmarks for a while now. With the client tests maturing, the time was right for a little convergence.
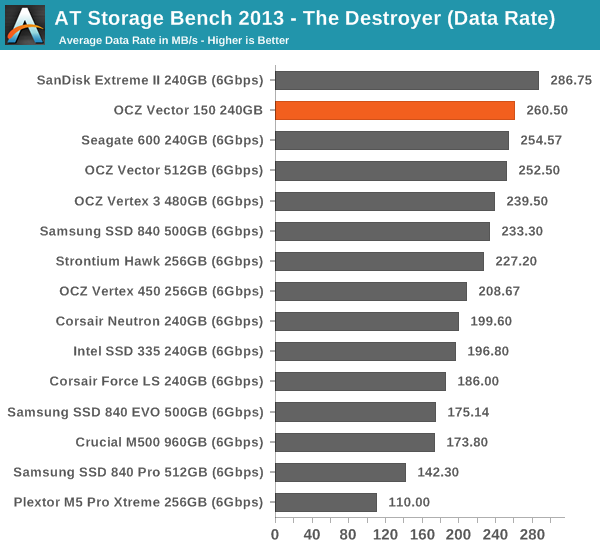
Like the performance consistency test hinted, the Vector 150 is top notch in terms of performance. SanDisk's Extreme II remains unbeatable but the Vector is the second fastest SSD in our new Storage Bench 2013. The original Vector has better average service time, but keep in mind that we're dealing with different capacities (240GB vs 512GB) -- steady-state performance usually scales up a little with more NAND. However, the difference between Vector 150 and Vertex 450 is significant.
Random Read/Write Speed
The four corners of SSD performance are as follows: random read, random write, sequential read and sequential write speed. Random accesses are generally small in size, while sequential accesses tend to be larger and thus we have the four Iometer tests we use in all of our reviews.
Our first test writes 4KB in a completely random pattern over an 8GB space of the drive to simulate the sort of random access that you'd see on an OS drive (even this is more stressful than a normal desktop user would see). I perform three concurrent IOs and run the test for 3 minutes. The results reported are in average MB/s over the entire time. We use both standard pseudo randomly generated data for each write as well as fully random data to show you both the maximum and minimum performance offered by SandForce based drives in these tests. The average performance of SF drives will likely be somewhere in between the two values for each drive you see in the graphs. For an understanding of why this matters, read our original SandForce article.
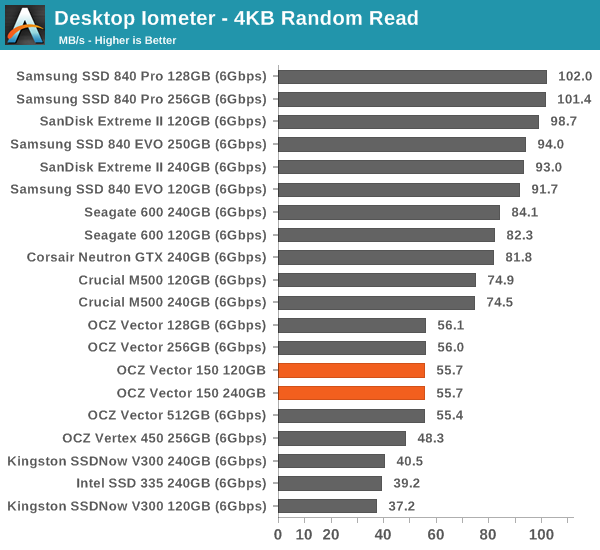
Random read performance remains unchanged but the Vector 150 wasn't supposed to bring any improvements to that anyway.
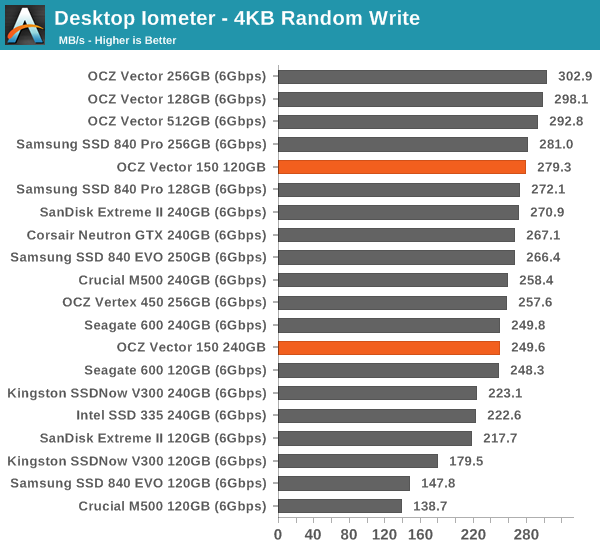
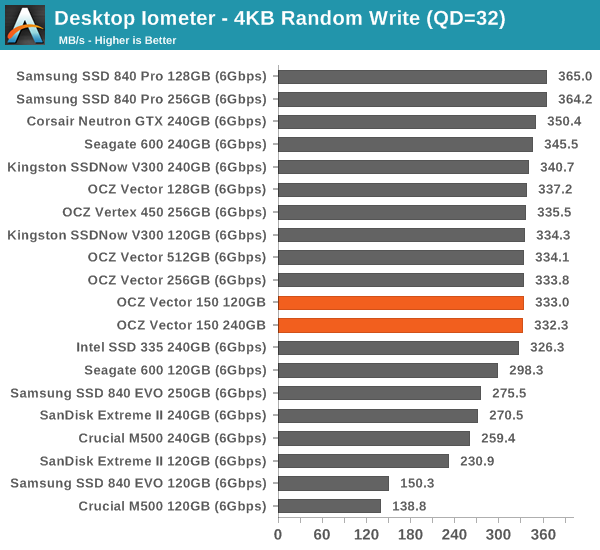
Random write speeds at queue depth of 3 take a hit, though I'm thinking this might be due to the new smaller process node NAND. When the queue depth is increased to 32, the performance is on-par with the original Vector thanks to parallelism.
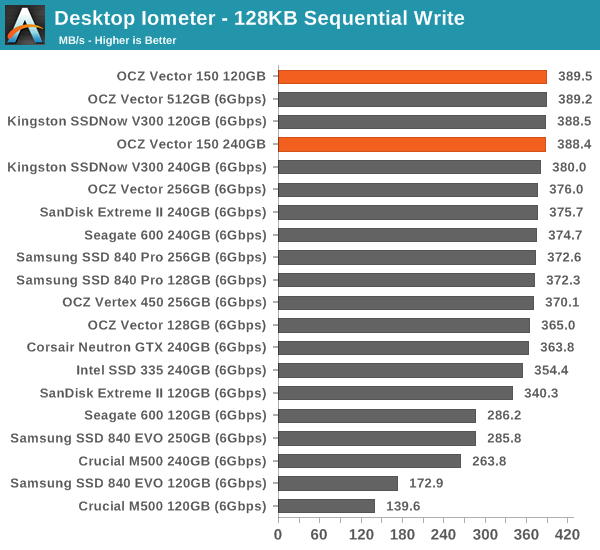
Sequential Read/Write Speed
To measure sequential performance I ran a 1 minute long 128KB sequential test over the entire span of the drive at a queue depth of 1. The results reported are in average MB/s over the entire test length.
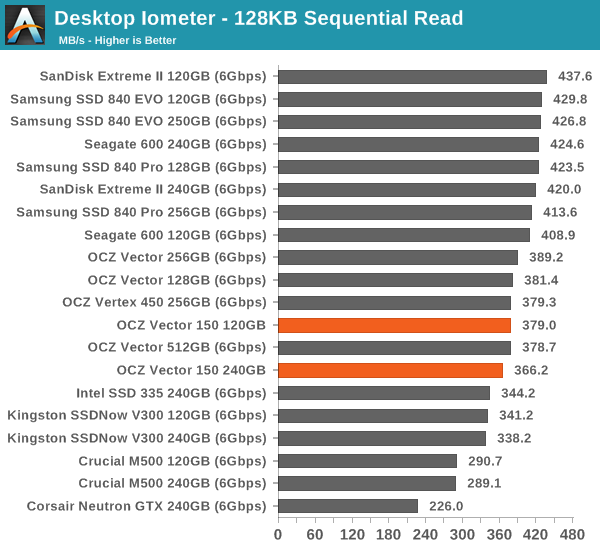
No surprises here either. Sequential performance has remained mostly the same for the last year or so and we won't see another bump until M.2 and other PCIe-based designs get more popular.
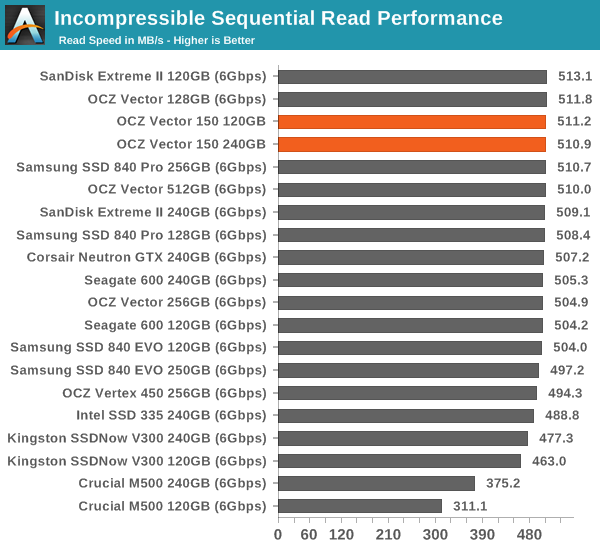
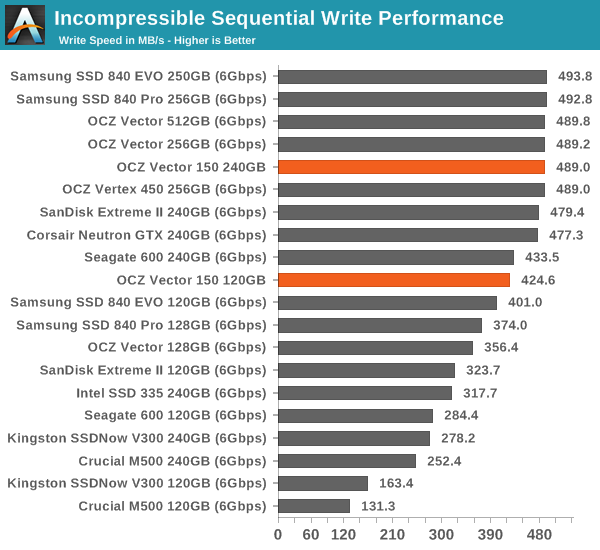
AS-SSD Incompressible Sequential Read/Write Performance
The AS-SSD sequential benchmark uses incompressible data for all of its transfers. The result is a pretty big reduction in sequential write speed on SandForce based controllers.
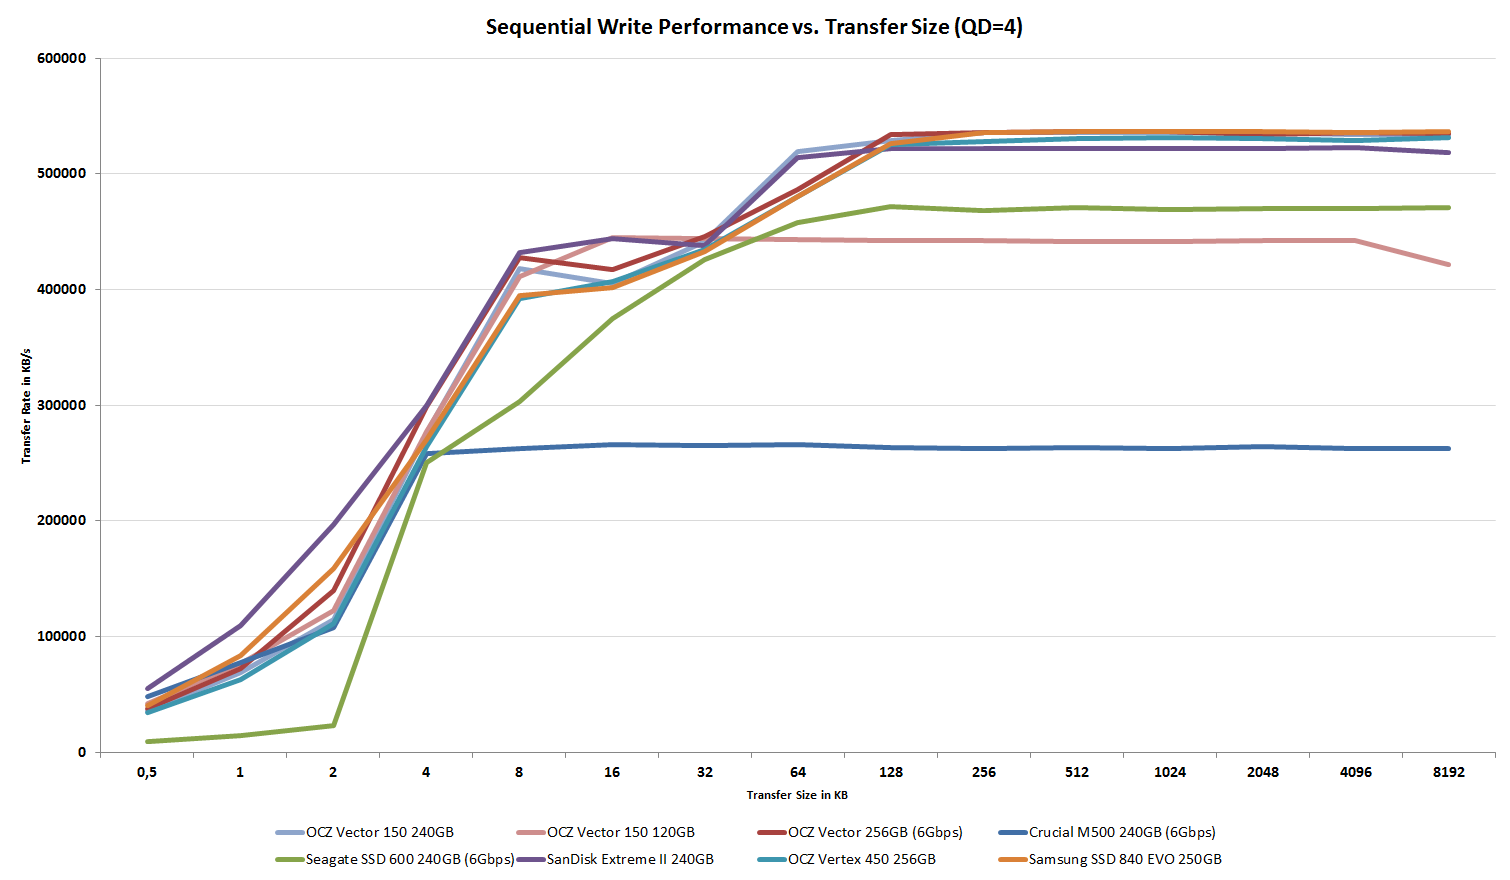
Performance vs. Transfer Size
ATTO is a useful tool for quickly benchmarking performance across various transfer sizes. You can get the complete data set in Bench. The Vector 150 doesn't really bring any changes to performance at different IO sizes. There's still the weird drop in read performance at transfer size of 32KB but other than that the performance is average.
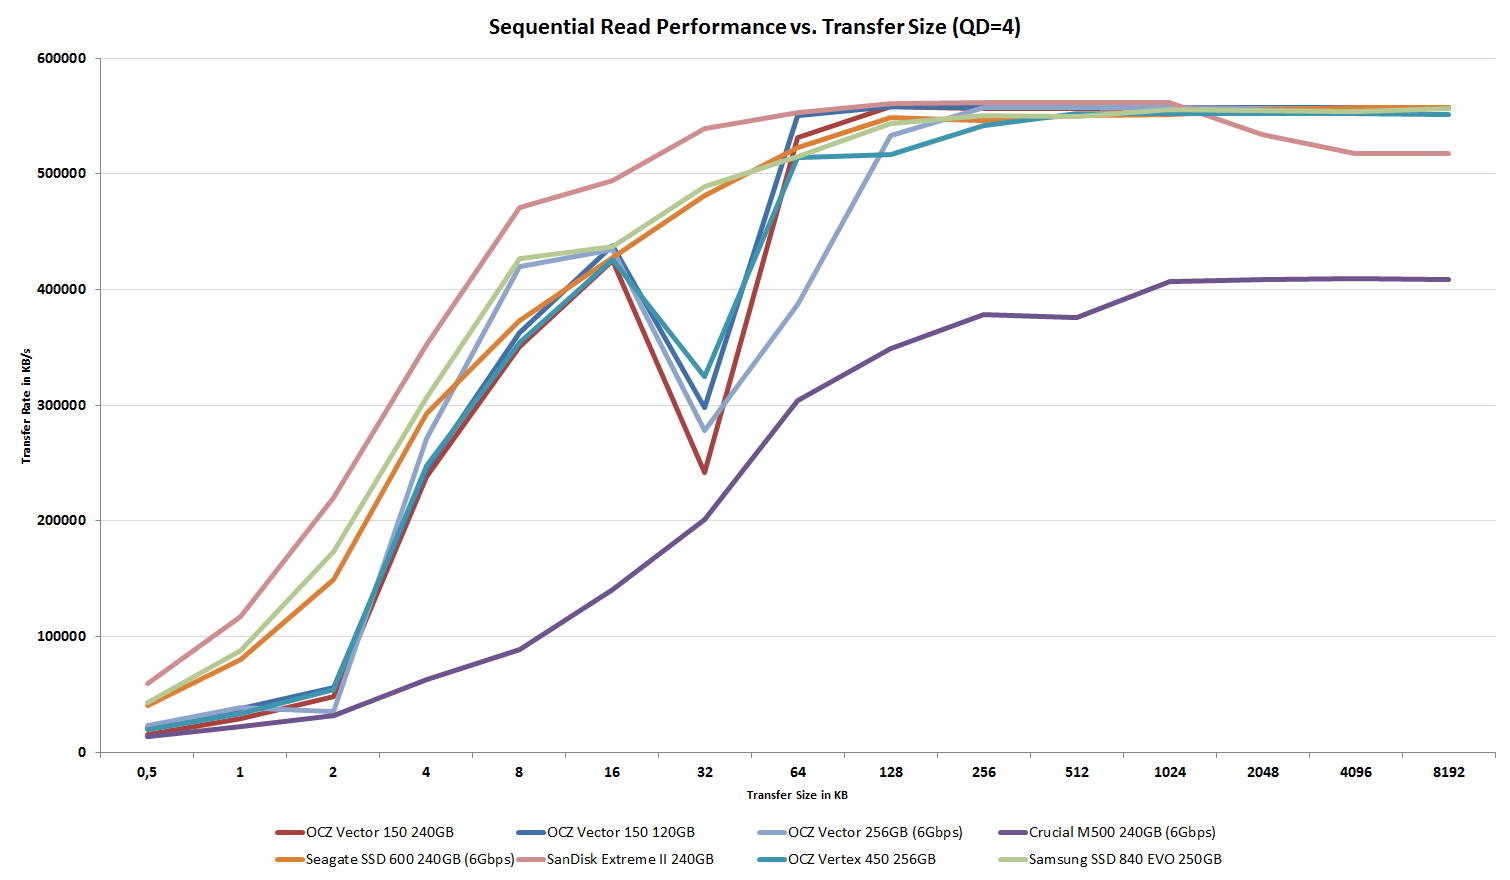
Click for full size
AnandTech Storage Bench 2011
Several years ago we introduced our AnandTech Storage Bench, a suite of benchmarks that took traces of real OS/application usage and played them back in a repeatable manner. Anand personally assembled the traces out of frustration with the majority of what we have today in terms of SSD benchmarks.
Although the AnandTech Storage Bench tests did a good job of characterizing SSD performance, they weren't stressful enough. All of the tests performed less than 10GB of reads/writes and typically involved only 4GB of writes specifically. That's not even enough exceed the spare area on most SSDs. Most canned SSD benchmarks don't even come close to writing a single gigabyte of data, but that doesn't mean that simply writing 4GB is acceptable.
Originally we kept the benchmarks short enough that they wouldn't be a burden to run (~30 minutes) but long enough that they were representative of what a power user might do with their system.
The next step was to create what we referred to as the Mother of All SSD Benchmarks (MOASB). Rather than only writing 4GB of data to the drive, this benchmark writes 106.32GB. It's the load you'd put on a drive after nearly two weeks of constant usage. And it takes a long time to run.
The MOASB, officially called AnandTech Storage Bench 2011 - Heavy Workload, mainly focuses on the times when your I/O activity is the highest. There is a lot of downloading and application installing that happens during the course of this test. The thinking was that it's during application installs, file copies, downloading and multitasking with all of this that you can really notice performance differences between drives.
We tried to cover as many bases as possible with the software incorporated into this test. There's a lot of photo editing in Photoshop, HTML editing in Dreamweaver, web browsing, game playing/level loading (Starcraft II & WoW are both a part of the test) as well as general use stuff (application installing, virus scanning). We included a large amount of email downloading, document creation and editing as well. To top it all off we even use Visual Studio 2008 to build Chromium during the test.
The test has 2,168,893 read operations and 1,783,447 write operations. The IO breakdown is as follows:
| AnandTech Storage Bench 2011 - Heavy Workload IO Breakdown | ||||
| IO Size | % of Total | |||
| 4KB | 28% | |||
| 16KB | 10% | |||
| 32KB | 10% | |||
| 64KB | 4% | |||
Only 42% of all operations are sequential, the rest range from pseudo to fully random (with most falling in the pseudo-random category). Average queue depth is 4.625 IOs, with 59% of operations taking place in an IO queue of 1.
Many of you have asked for a better way to really characterize performance. Simply looking at IOPS doesn't really say much. As a result we're going to be presenting Storage Bench 2011 data in a slightly different way. We'll have performance represented as Average MB/s, with higher numbers being better. At the same time we'll be reporting how long the SSD was busy while running this test. These disk busy graphs will show you exactly how much time was shaved off by using a faster drive vs. a slower one during the course of this test. Finally, we will also break out performance into reads, writes and combined. The reason we do this is to help balance out the fact that this test is unusually write intensive, which can often hide the benefits of a drive with good read performance.
There's also a new light workload for 2011. This is a far more reasonable, typical every day use case benchmark. Lots of web browsing, photo editing (but with a greater focus on photo consumption), video playback as well as some application installs and gaming. This test isn't nearly as write intensive as the MOASB but it's still multiple times more write intensive than what we were running in 2010.
These two benchmarks alone are not enough to characterize the performance of a drive, but hopefully along with the rest of our tests they will help provide a better idea. The testbed for Storage Bench 2011 has changed as well. We're now using a Sandy Bridge platform with full 6Gbps support for these tests.
AnandTech Storage Bench 2011 - Heavy Workload
We'll start out by looking at average data rate throughout our heavy workload test:
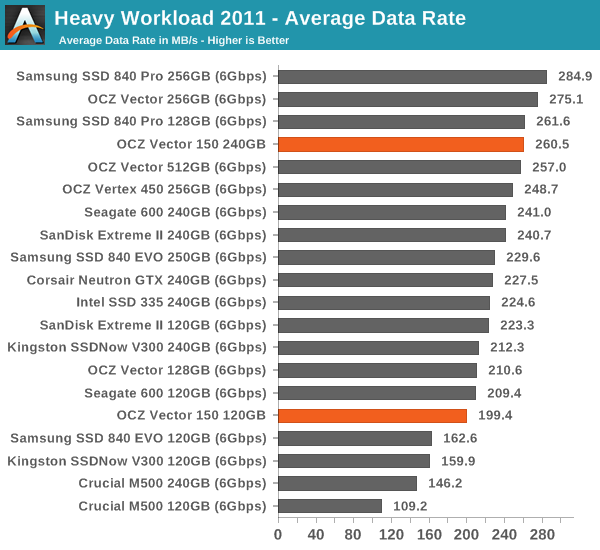
The Vector 150 is a bit slower than the original Vector in our 2011 Heavy workload test but the difference isn't significant. The slight performance loss here is compensated for by the increased IO consistency. I decided not to include all of the graphs here since the average data rate is the only truly meaningful data point these days but you can still find the complete dataset in our Bench.
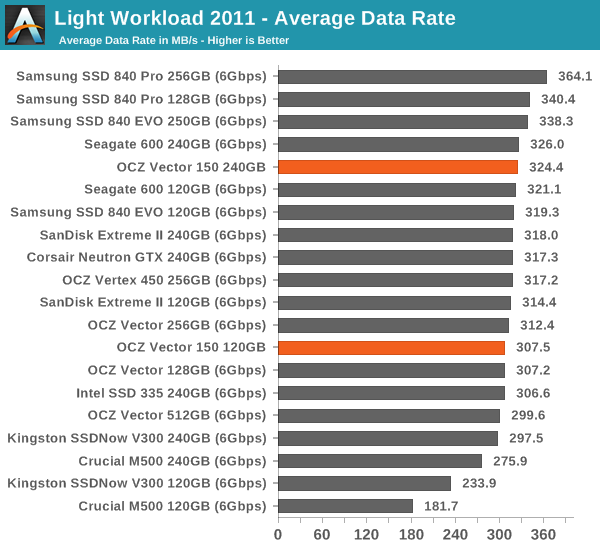
AnandTech Storage Bench 2011 - Light Workload
Our light workload actually has more write operations than read operations. The split is as follows: 372,630 reads and 459,709 writes. The relatively close read/write ratio does better mimic a typical light workload (although even lighter workloads would be far more read centric). The I/O breakdown is similar to the heavy workload at small IOs, however you'll notice that there are far fewer large IO transfers:
| AnandTech Storage Bench 2011 - Light Workload IO Breakdown | ||||
| IO Size | % of Total | |||
| 4KB | 27% | |||
| 16KB | 8% | |||
| 32KB | 6% | |||
| 64KB | 5% | |||
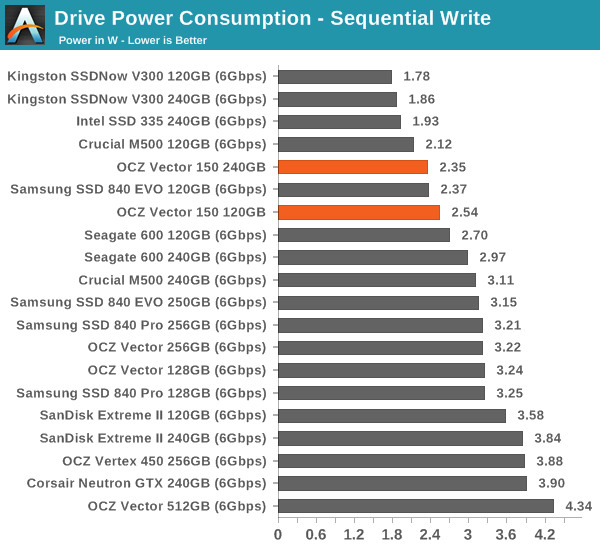
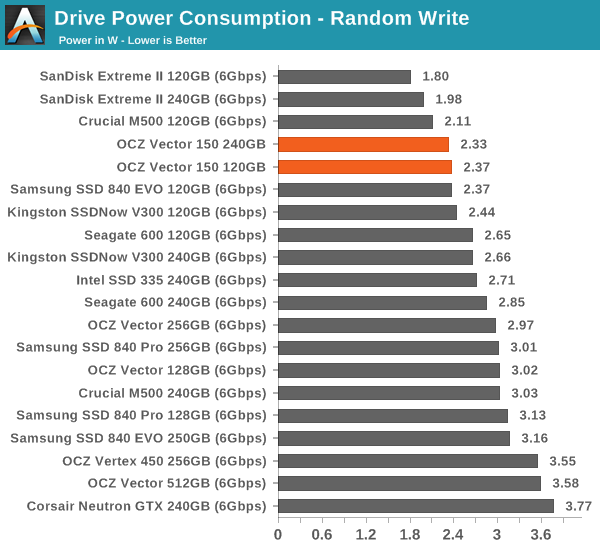
Power Consumption
Like I mentioned on the introduction page, the Vector 150 doesn't support any form of ACHI Link Power Management (also known as HIPM and DIPM) nor does it support Windows 8's DevSleep. Even with those disabled, the idle power consumption ends up being higher than Samsung's although it's good to see that OCZ has done some improvements compared to the original Vector. Power consumption under load, on the other hand, is very good as OCZ is able to stay within their 2.5W spec.

Final Words
The Vector 150 is a logical successor for the Vector. It doesn't redefine SSD performance, yet OCZ has managed to add enough improvements to the Vector 150 to make it a different product. The first one is IO consistency. While the Vector had good performance consistency to begin with, the Vector 150 takes that one step further. It's without a doubt one of the most consistent (if not the most consistent) SSDs we have tested and that's a big achievement. Especially for heavy workloads with lots of random writes the IO consistency is a very important performance metric because the drives tend to be in steady-state (or close to it) due to the amount of writes and you definitely don't want your application to be waiting for your SSD.
The second major improvement is endurance. 50GB/day for five years should cover almost any power user's need for endurance (or if not, you should really invest in an enterprise class SSD). Remember that it's 50GB seven days a week for five years -- even one day with less writes a week will give you even more headroom to play with.
Power consumption is the only thing I have a problem with. For desktops the power consumption obviously plays no role (unless you're building a huge RAID array and want it to be as power efficient as possible) but for mobile it's one of the cornerstones. Battery life is one of those things where you can never have enough and while the rest of the components usually play the bigger role, an SSD can still have an impact of half an hour or so depending on your laptop.
| NewEgg Price Comparison (11/6/2013) | |||
| 120/128GB | 240/256GB | 480/512GB | |
| OCZ Vector 150 (MSRP) | $130 | $240 | $500 |
| OCZ Vector | $125 | N/A | N/A |
| OCZ Vertex 450 | $115 | $220 | $460 |
| Samsung SSD 840 EVO | $100 | $180 | $340 |
| Samsung SSD 840 Pro | $128 | $215 | $570 |
| Crucial M500 | $120 | $155 | $370 |
| SanDisk Extreme II | $150 | $230 | $460 |
| Seagate SSD 600 | $110 | $200 | $380 |
With the original Vector OCZ shifted their goals and tried to lift up their brand image by focusing purely on the high-end segment and the Vector 150 continues that strategy. As a result, the Vector 150 is definitely at the upper pricing segment but there is always a price you have to pay for performance. Compared to SanDisk's Extreme II, Vector 150's most likely rival, the MSRPs are fairly competitive. At 120GB, the Vector is cheaper but at higher capacities SanDisk has a small advantage. However, it's good to keep in mind that we're dealing with MSRPs, so take the prices with a grain of salt until we see what the retail prices end up being.
All in all, I'm excited to see what OCZ has up their sleeve for their SATA Express (i.e. PCIe) based Barefoot 3 successor. We've been limited by the SATA 6Gbps bus for quite a while already, which is why there haven't been any tremendous upgrades in performance compared to what for example the SF-2281 brought when it was first released. The Barefoot 3 is a platform with lots of potential and it shows that OCZ's Indilinx and PLX acquisitions have provided the company with the knowledge they need to stay competitive in the SSD space.


