Original Link: https://www.anandtech.com/show/5710/the-adata-xpg-sx900-128gb-review-maximizing-sandforce-capacity
ADATA XPG SX900 (128GB) Review: Maximizing SandForce Capacity
by Kristian Vättö on June 8, 2012 1:25 AM ESTIntroduction
SandForce sets aside more NAND capacity than most controllers for spare area. While Intel, Marvell, Samsung and others default to ~7% of total NAND capacity for spare area, SandForce is almost double that. The difference boils down to RAISE, SandForce's NAND redundancy algorithm that requires the consumption of a full NAND die. The original idea was that RAISE and SandForce's DuraWrite technology could allow SSD vendors to use cheaper, less reliable NAND without any impact to the end user. It seems as though no one was willing to risk using anything but the best NAND, so we never really saw this feature exploited. A bit over a month ago, ADATA released their XPG SX900 series. It utilizes the oh-so-common SF-2281 controller but unlike other SandForce SSDs, RAISE is disabled - giving the end user more usable space.
Maximizing SandForce Capacity - How it's done
When an SSD is marketed as for example 120GB, it must have 120GB of usable space (before formatting, of course). However, the advertised capacity does not always reflect the raw NAND capacity. Both 120GB and 128GB SSDs actually have 128GiB of NAND onboard. Notice that GB and GiB are not the same. As these two are easily confused with one and another, let's revisit the topic quickly.
Giga is a prefix for billion or 10^9. That means one Gigabyte is 1,000,000,000 bytes. Gibi, on the other hand, is a prefix for 1024^3, or 2^30. Do the math and one Gibibyte works out to be 1,073,741,824 bytes. The confusing part here is that Windows uses Gibibytes for capacities but with the GB abbreviation. (As an aside, Microsoft and others have used "GB" for 2^30 some time, and "Gibibytes" and the other binary SI prefixes only came into being in 1998.) That's why we often say Gigabytes although we really mean Gibibytes. Under Windows, a 128GB SSD is actually shown as a 119GB drive, although in reality it's 119GiB.
As SSDs capacities are advertised in Gigabytes, there is always some "hidden" space thanks to Gigabyte to Gibibyte translation. A 120GB SandForce SSD has ~17.4GB or 12.7% of space that is inaccessible by the end-user. What is that space used for then? Two words: RAISE and over-provisioning.
RAISE (Redundant Array of Independent Silicon Elements) uses the capacity of one NAND die (8GiB for 2x-nm NAND) for parity data. Hence you can lose up to a full NAND package worth of data without losing anything from the user's standpoint. While RAISE is optional, all SandForce SSD manufacturers have enabled it on +120GB drives thus far. 60GB SSDs have RAISE disabled because the user accessible space would be only ~56GB with 8GiB for RAISE and ~7% for over-provisioning.
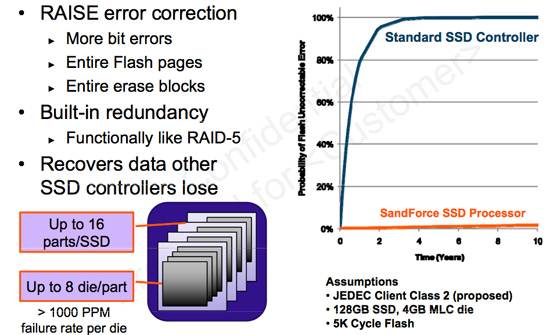
Let's illustrate this situation by looking at how the space in a 120GB SSD is used. RAISE needs a full NAND die so that's 8GiB which needs to be substracted from the raw 128GiB. We are at 120GiB now. As 120GB is user accessible space, that needs to be substracted as well, which means the space left for over-provisioning is ~8.8GB or 6.9%.
So, now we know how the space in a typical SandForce SSD is allocated, but what exactly has ADATA disabled or decreased to achieve a higher capacity? An SSD cannot work without over-provisioning because it would have no space to do garbage collection, wear leveling, and bad block replacement. 0% OP is impossible as the drive could not function if it was filled. That leaves us with RAISE. ADATA has simply disabled RAISE to gain the extra 8GiB and make 8GB of it user accessible (the remaining ~0.6GB is used for OP to keep the OP percentage the same).
And that's it. There are no extra tricks, no extra NAND onboard, and no special controller or other magic. All SF-2200 series controllers support a RAISE-disabled mode, and ADATA is simply the first one to employ it on a drive larger than 64GB. This actually brings us to the next question: What has ADATA done with the 64GB drive?
60GB SandFroce drives already have RAISE disabled because with 8GiB for RAISE and 7% for OP, the usable capacity and hence advertised size would only be 56GB. When RAISE is disabled, there is actually 12.7% left for OP on a 60GB SF drive. ADATA has simply decreased the amount of space dedicated to OP to 7%, which yields a usable capacity of 64GB (or 63.9GB to be exact).
According to SandForce, RAISE is not even necessary for consumer workloads and the built-in 55-bit BCH ECC engine should be effective enough for error correcting. Personally, I would rather lose a small proportion of capacity to prevent potential data loss, but everyone's point of view is different. In my opinion, if you need the extra capacity that one NAND package provides, then your SSD is too small to begin with. It's always a pain in the neck to deal with a drive that's nearly full, especially if it's your boot drive.
The ADATA XPG SX900
ADATA sent us a 128GB review sample. Below is the specification table for the XPG SX900 family:
| ADATA XPG SX900 Specifications | ||||
| Model | 64GB | 128GB | 256GB | 512GB |
| Raw NAND Capacity | 64GiB | 128GiB | 256GiB | 512GiB |
| User Capacity | 59.6GiB | 119.2GiB | 238.4GiB | 476.8GiB |
| Number of NAND Packages | 8 | 16 | 16 | 16 |
| Number of Die per Package | 1 | 1 | 2 | 4 |
| Sequential Read | 550MB/s | 550MB/s | 550MB/s | 540MB/s |
| Sequential Write | 510MB/s | 520MB/s | 530MB/s | 465MB/s |
| 4K Random Read | 15K IOPS | 20K IOPS | 39K IOPS | 55K IOPS |
| 4K Random Write | 87K IOPS | 88K IOPS | 90K IOPS | 47K IOPS |
| Price | $110 | $170 | $330 | $670 |
Performance is exactly what you would expect from a SF-2281 drive. RAISE does not impact performance so this is not surprising.
| Best Online Price Comparison (5/22/2012) | ||||
| 60/64GB | 120/128GB | 240/256GB | 480/512GB | |
| ADATA XPG SX900 | $90 | $160 | $300 | $610 |
| Plextor M3 | $119 | $156 | $279 | $650 |
| Crucial m4 | $80 | $129 | $220 | $535 |
| Intel 520 Series | $115 | $169 | $330 | $819 |
| Samsung 830 Series | $85 | $130 | $285 | $659 |
| OCZ Agility 3 | $70 | $120 | $210 | $500 |
| OCZ Vertex 3 | $85 | $130 | $250 | $660 |
| OCZ Vertex 4 | N/A | $140 | $290 | $640 |
| Mushkin Enhanced Chronos | $68 | $103 | $200 | $450 |
Pricing is not bad but could definitely be more competitive. The SX900 is cheaper than the Intel 520 Series while offering more capacity, but the Crucial m4, Samsung 830 Series, and OCZ Vertex 3 still beat it for most capacities. The Crucial m4 and Samsung 830 Series in particular are the two SSDs that you need to beat in order to succeed--they both offer powers-of-two capacities and seem to be very reliable, and the Samsung 830 Series in particular is also one of the fastest SSDs on the market.
I also decided to include Mushkin in the comparison because many of you have been speaking of their drives in the comments. I won't go in-depth about Mushkin right now, but the Chronos series uses a SandForce SF-2281 controller and asynchronous Micron NAND, which is very similar to OCZ's Agility 3.
It's good to keep in mind, however, that SSD prices fluctuate a lot as sales come and go. I started with the table from our Corsair Performance Pro review, but then widened our search criteria to include other online vendors; there have been plenty of changes just in the past week or so. If you are buying a new SSD, my advice would be to follow the prices for at least a few days, as you can easily save $20 or more by doing so.
As we are dealing with slightly different capacities due to the fact that most SandForce SSDs have RAISE enabled, the best way to look at this data is to compare the price per GB:
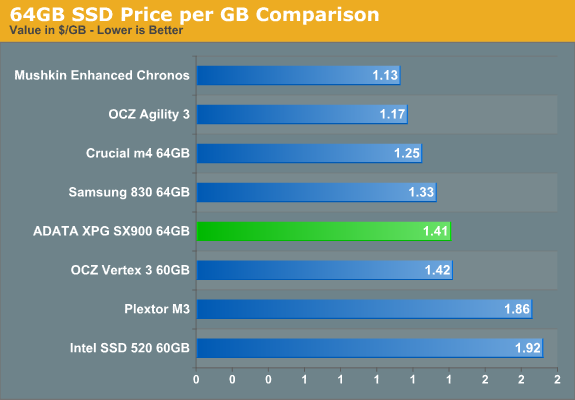
The 64GB model is in the middle of the pack in terms of pricing, basically matching the Vertex 3. The Intel SSD 520 and Plextor M3 are both substantially more expensive per GB, which is not where you want to be for a "value" capacity SSD. Given that factor, the Mushkin is currently the drive to beat for 60/64GB.
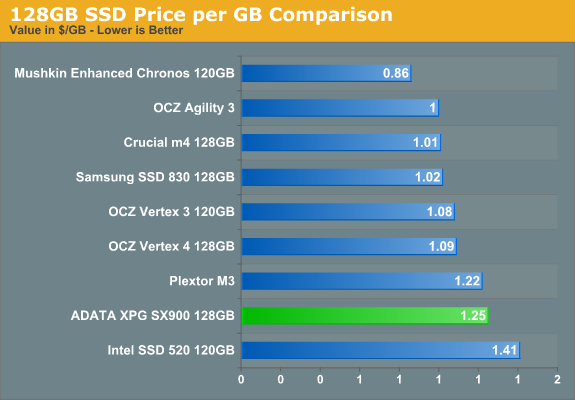
The 128GB SX900 doesn't do very well at 128GB, dropping further down our charts. Price per GB is higher than the other options--again, with the exception of the Intel 520. Even though the SX900 has 8GB more usable space, in terms of value you'd be much better off with something like the Samsung 830, Crucial m4, or the Chronos and Agility 3.
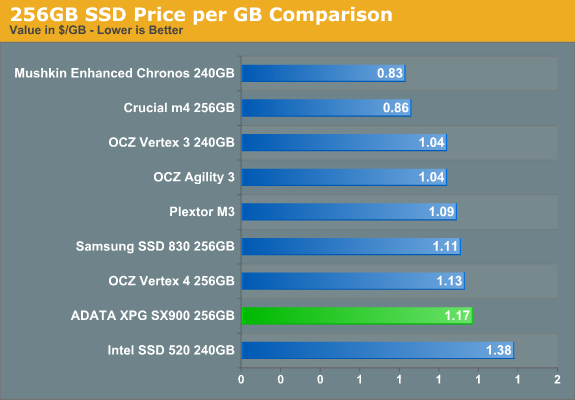
At 256GB, the trend continues with the SX900 again only offering better "value" (not taking into account firmware and reliability factors) than the Intel 520. It's only slightly more than the Vertex 4 and Samsung 830, but again we're looking at the same capacity for those two drives.
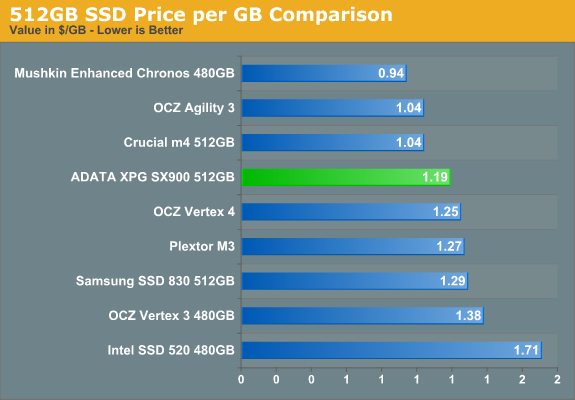
Only at 512GB does ADATA finally manage to place in the top half of our pricing charts. At these capacities, sales volume is much lower due to the overall high pricing, but outside of the Agility 3 and Chronos (which use slightly slower asynchronous NAND), the SX900 is the least expensive SF-2281 based high capacity SSD.
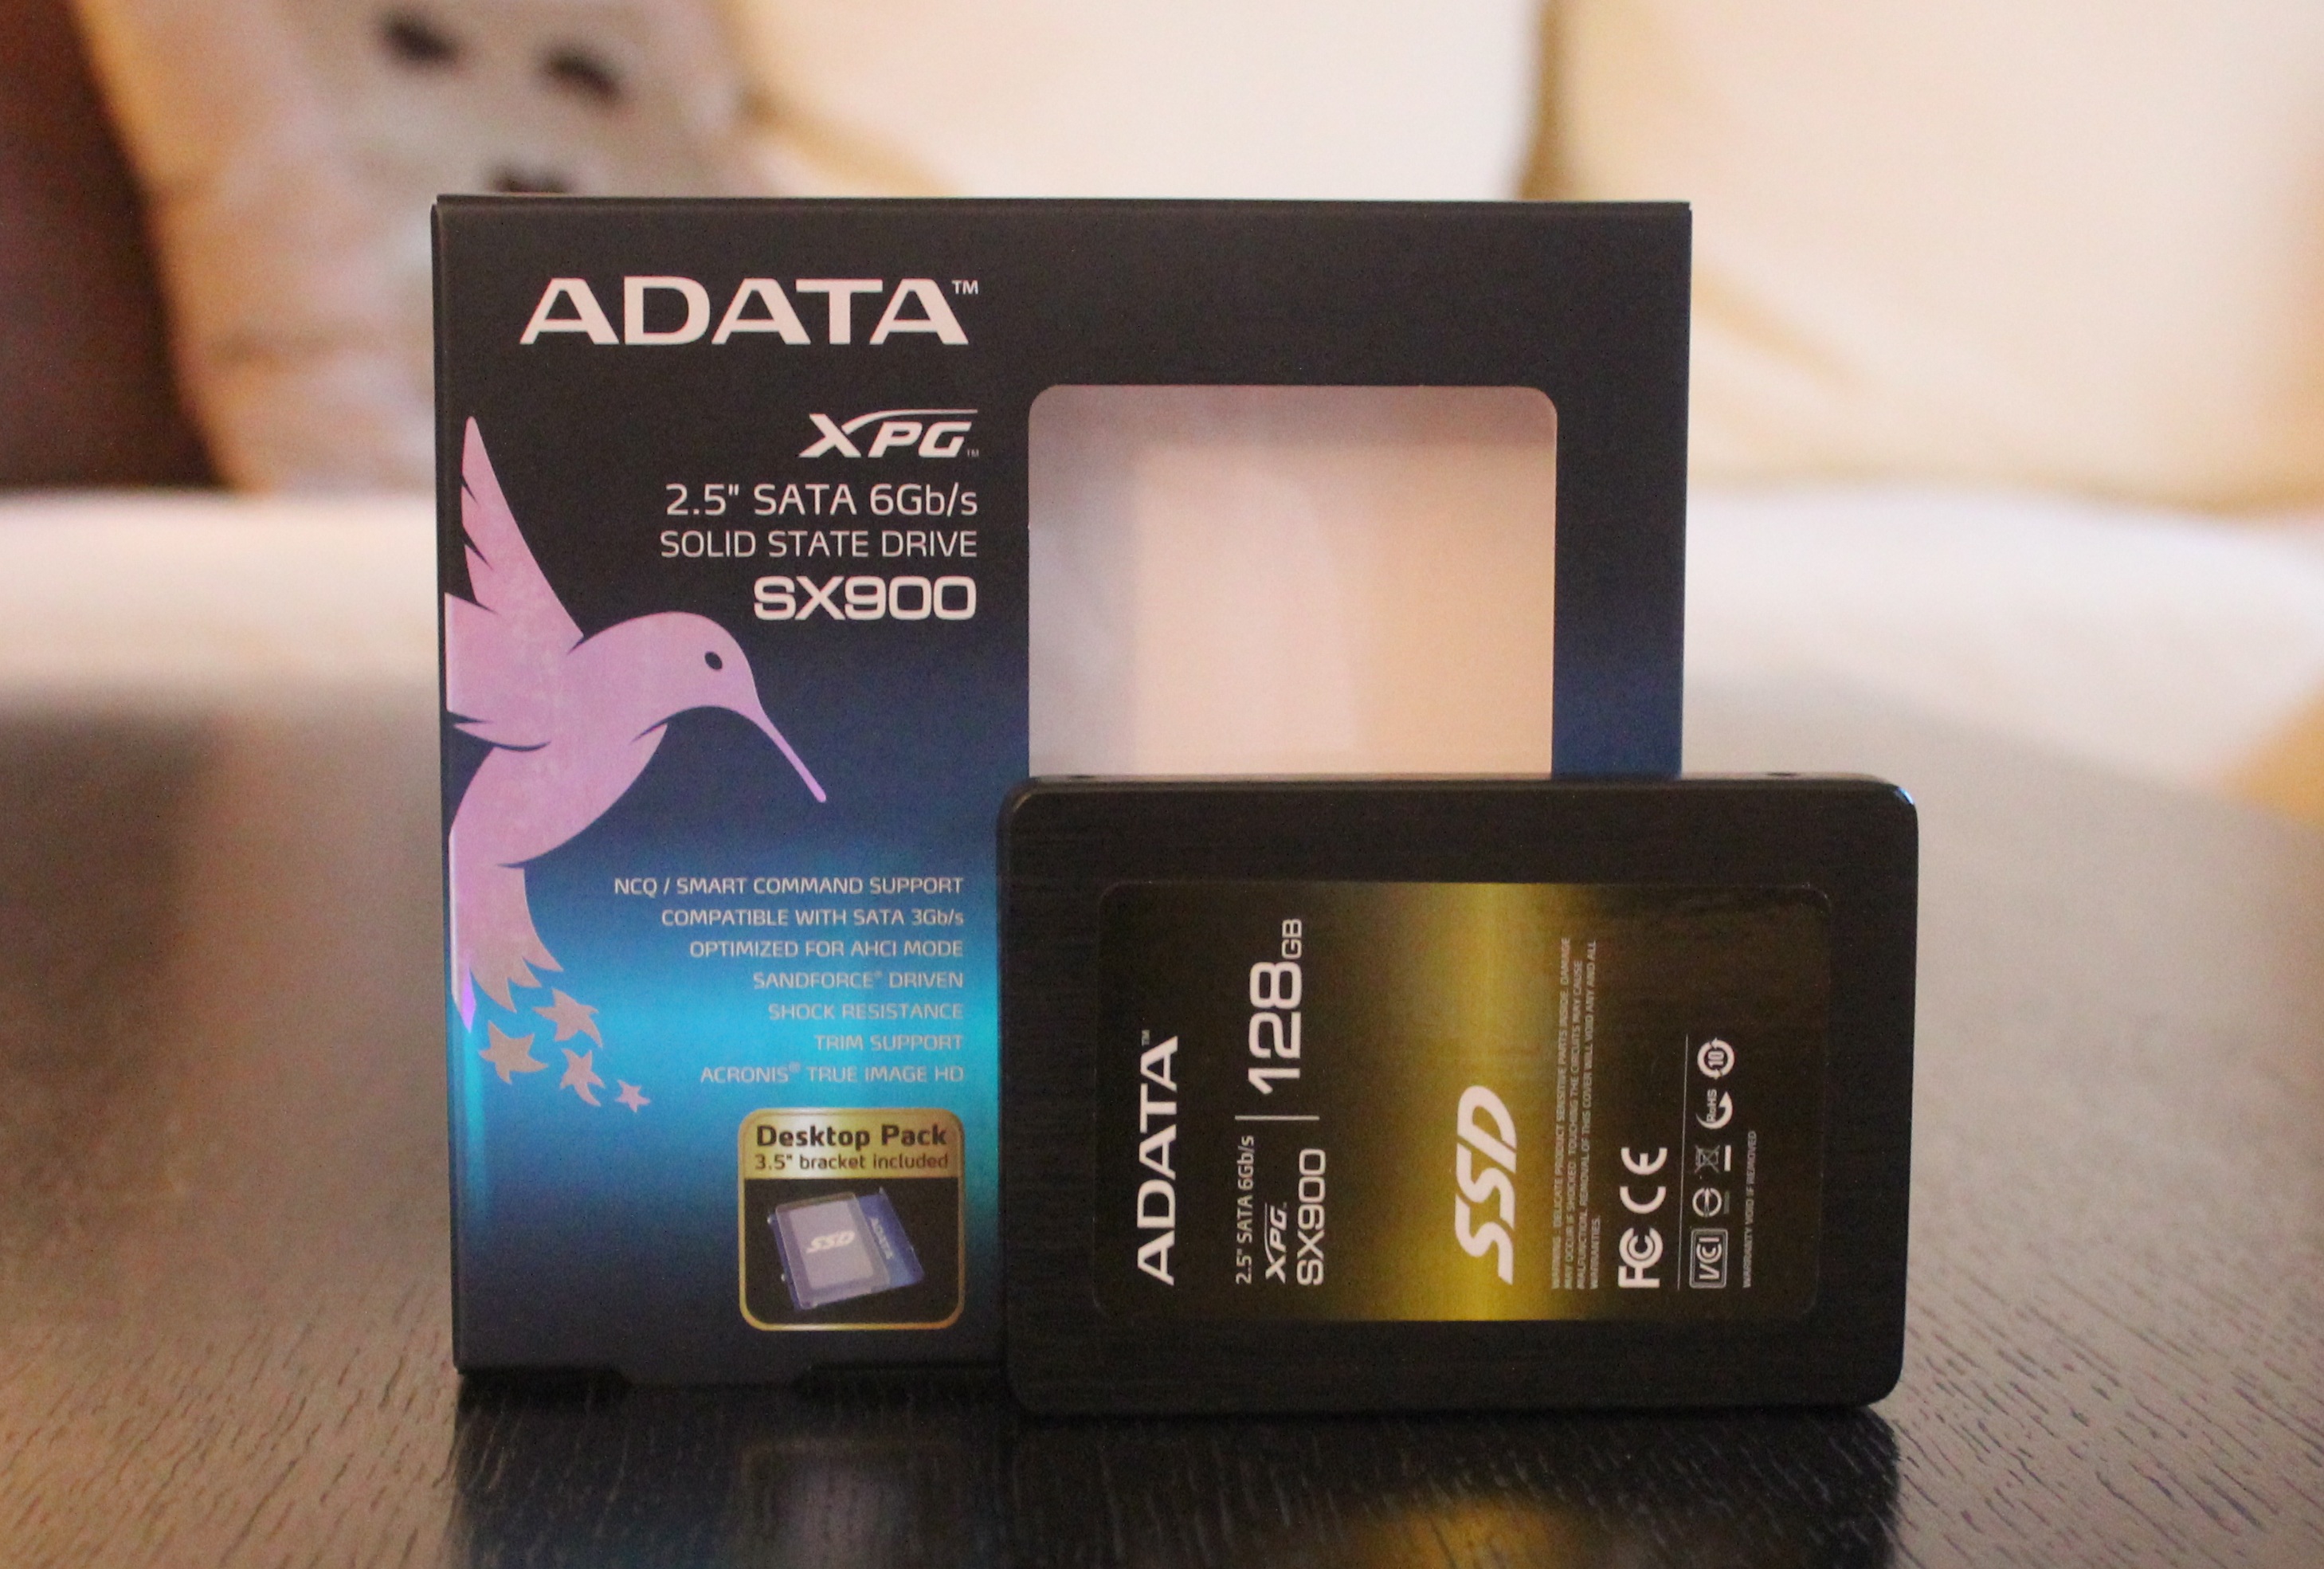
The drive comes with compact packaging. There is a 3.5" desktop bracket included along with mounting screws and a quick installation guide. There is no software CD included but ADATA offers a free Acronis True Image HD download, which is a handy backup/cloning utility. The 3-year warranty that ADATA gives is pretty standard for an SSD, but it could be better as for example Intel and Plextor offer 5-year warranties. The front side of the drive is covered by a big sticker that has ADATA's logo, the model number, and the capacity of the drive.
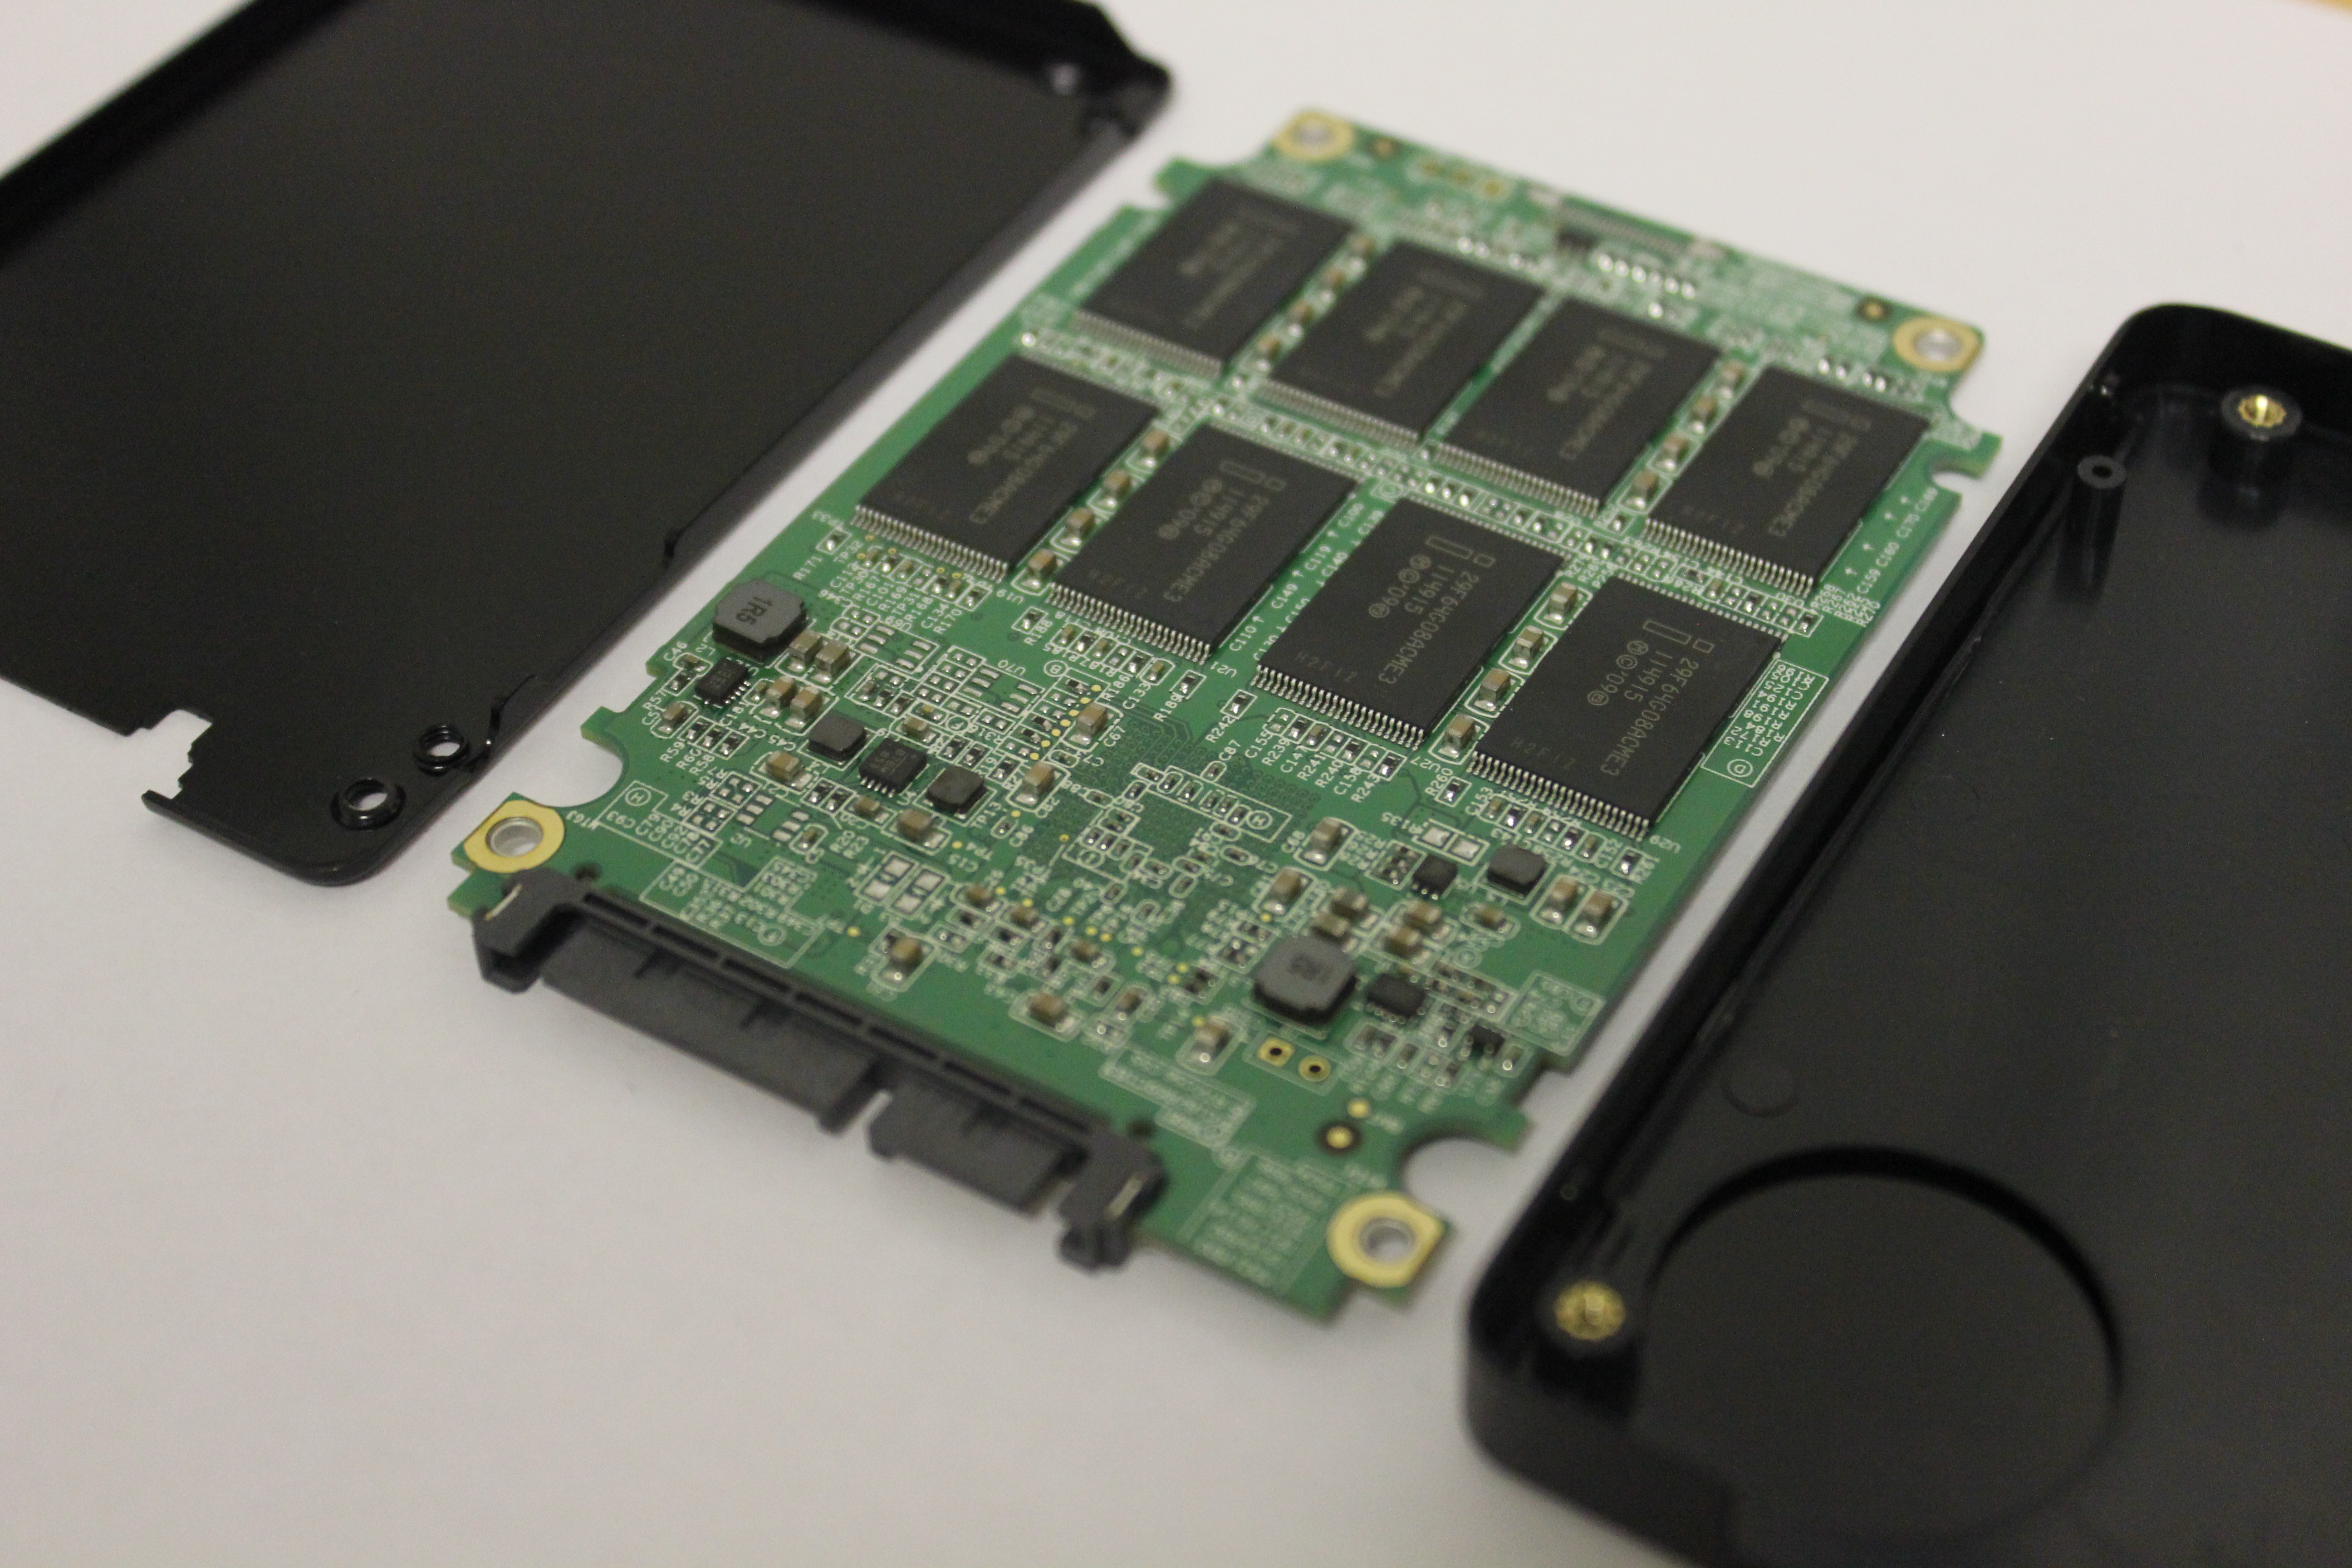
When we take the drive apart and see what's inside, there's not much out of the ordinary. There are only four screws keeping the whole package in place. It's not unheard of but the typical approach is to screw the PCB on the bottom part of the chassis and then screw the bottom part of the chassis to the top part.
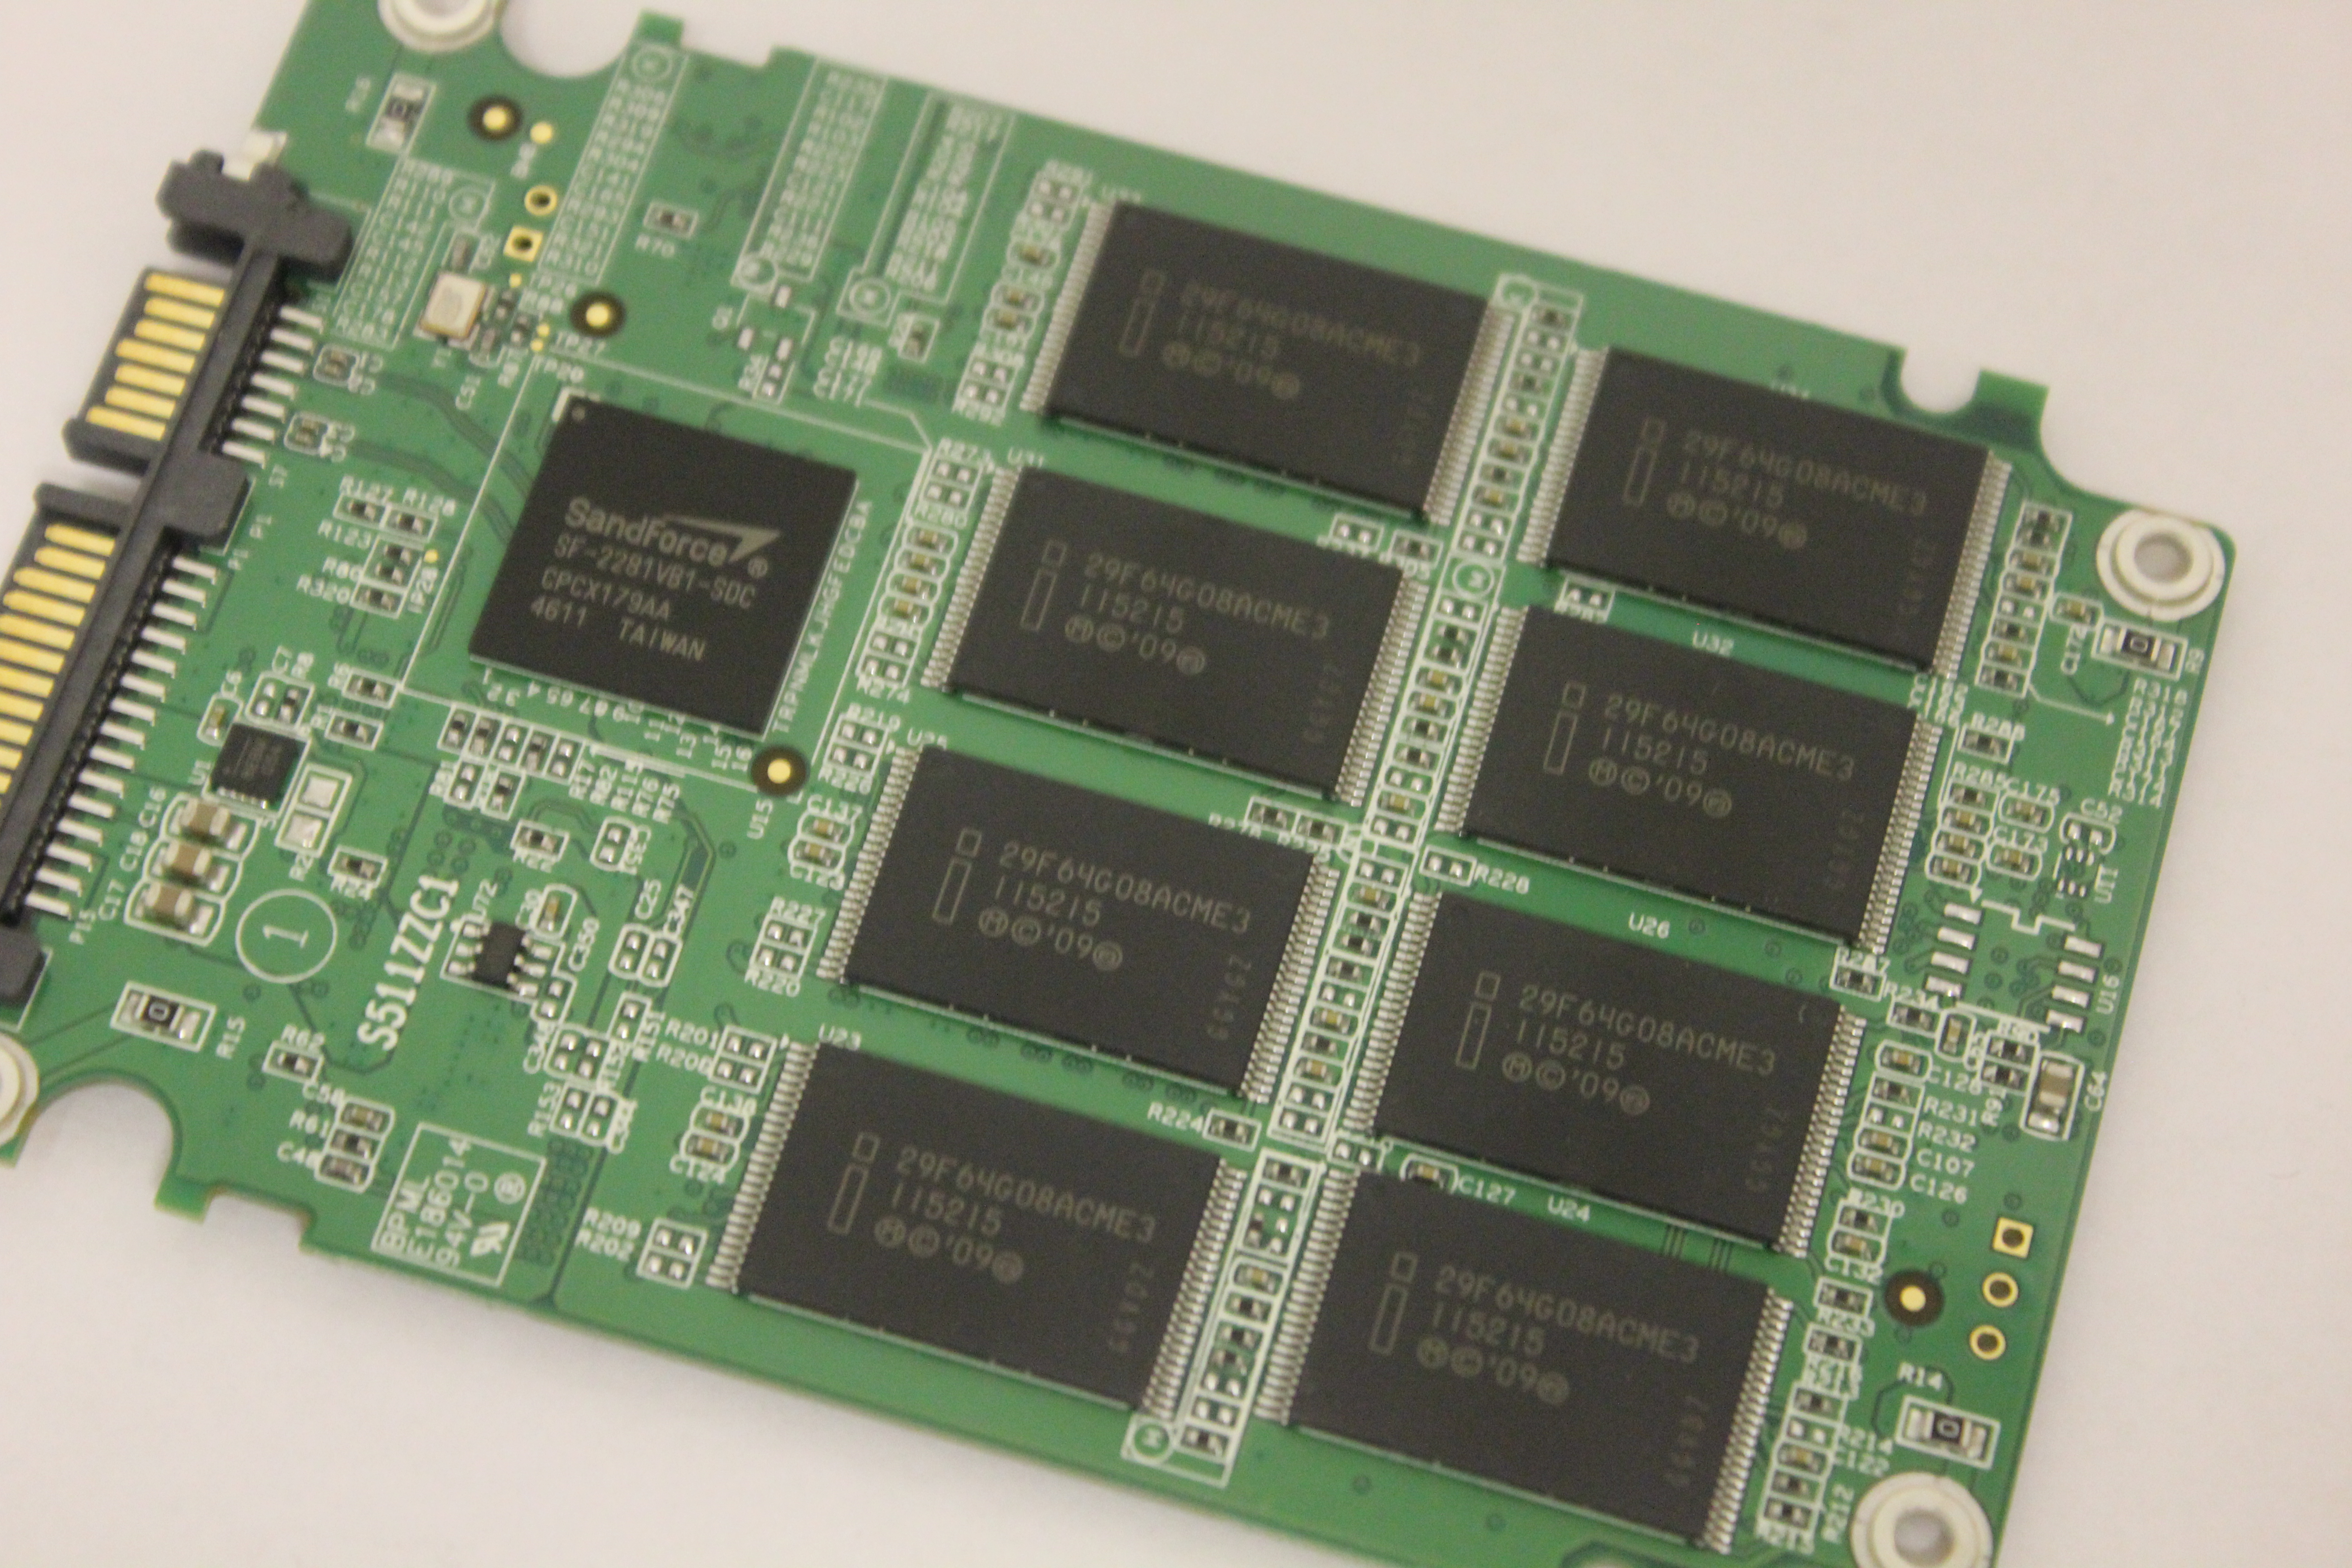
On the actual PCB, there are sixteen 25nm Intel MLC ONFi 2.x (synchronous) NAND devices, eight on each side. Since this is a 128GB drive, it means all NAND devices consist of a single 8GiB die. As expected, the controller is SF-2281.
The Test
| CPU |
Intel Core i5-2500K running at 3.3GHz (Turbo and EIST enabled) |
| Motherboard |
AsRock Z68 Pro3 |
| Chipset |
Intel Z68 |
| Chipset Drivers |
Intel 9.1.1.1015 + Intel RST 10.2 |
| Memory | G.Skill RipjawsX DDR3-1600 2 x 4GB (9-9-9-24) |
| Video Card |
XFX AMD Radeon HD 6850 XXX (800MHz core clock; 4.2GHz GDDR5 effective) |
| Video Drivers | AMD Catalyst 10.1 |
| Desktop Resolution | 1920 x 1080 |
| OS | Windows 7 x64 |
Random Read/Write Speed
The four corners of SSD performance are as follows: random read, random write, sequential read and sequential write speed. Random accesses are generally small in size, while sequential accesses tend to be larger and thus we have the four Iometer tests we use in all of our reviews. Our first test writes 4KB in a completely random pattern over an 8GB space of the drive to simulate the sort of random access that you'd see on an OS drive (even this is more stressful than a normal desktop user would see). I perform three concurrent IOs and run the test for 3 minutes. The results reported are in average MB/s over the entire time. We use both standard pseudo randomly generated data for each write as well as fully random data to show you both the maximum and minimum performance offered by SandForce based drives in these tests. The average performance of SF drives will likely be somewhere in between the two values for each drive you see in the graphs. For an understanding of why this matters, read our original SandForce article.
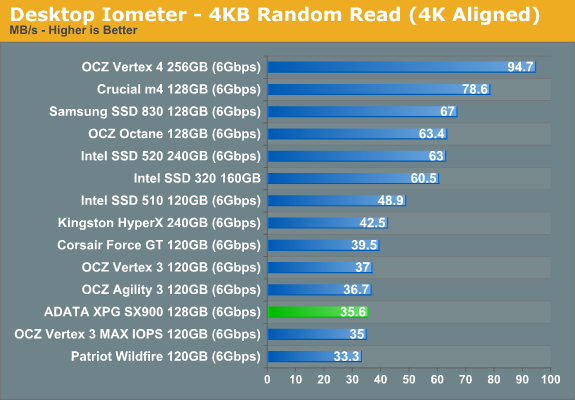
Random read performance has never been a strength of SandForce as even Intel SSD 320 outperforms most SandForce based SSDs. As the graph shows, the SX900 is on-par with other 120/128GB SandForce drives.
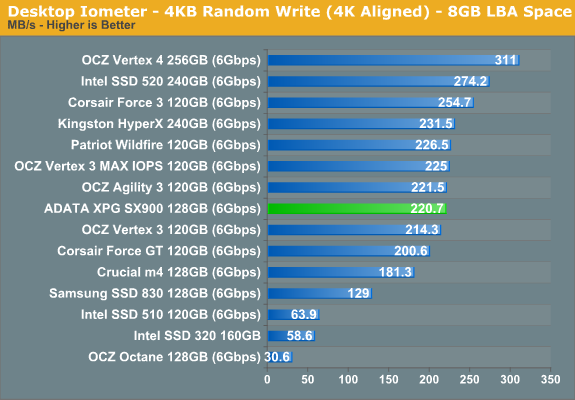
4KB random write performance is no different from other SandForce drives. Only Intel SSD 520 and Corsair Force 3 are noticeably faster, while others fall in the same 215-230MB/s range.
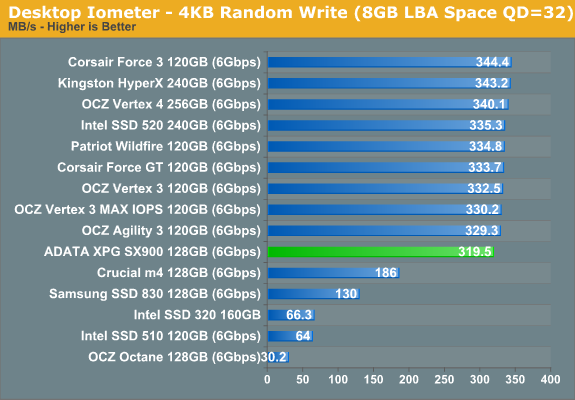
Increasing the queue depth to 32 doesn't change the story. While the SX900 is the slowest SandForce drive in this test, it's less than 5% slower than the majority of SF-2281 drives.
Sequential Read/Write Speed
To measure sequential performance I ran a 1 minute long 128KB sequential test over the entire span of the drive at a queue depth of 1. The results reported are in average MB/s over the entire test length.
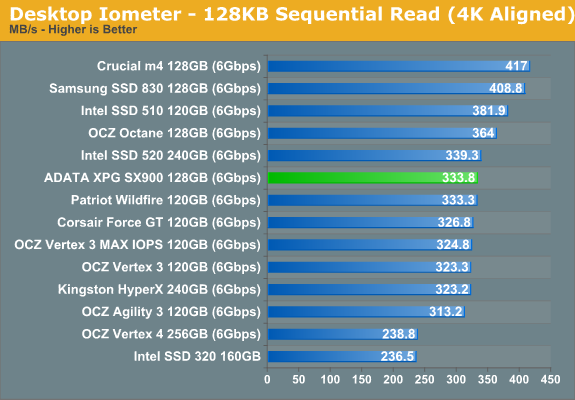
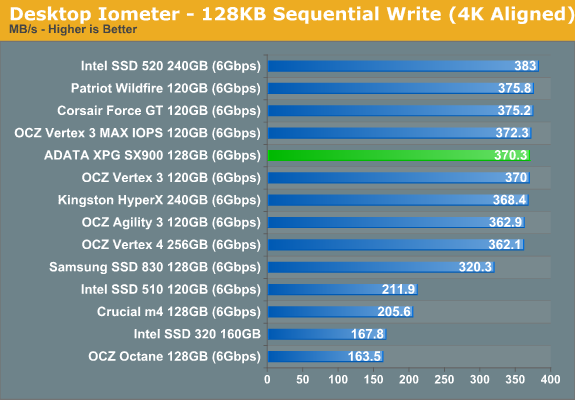
Both sequential read and write speeds are almost the same for all SandForce SF-2200 series SSDs and the SX900 is no exception. This isn't a surprise given that the firmware is essentially the same in all SandForce SSDs, with the exception of the Intel 520 series.
AS-SSD Incompressible Sequential Performance
The AS-SSD sequential benchmark uses incompressible data for all of its transfers. The result is a pretty big reduction in sequential write speed on SandForce based controllers. Read speeds are largely unaffected.
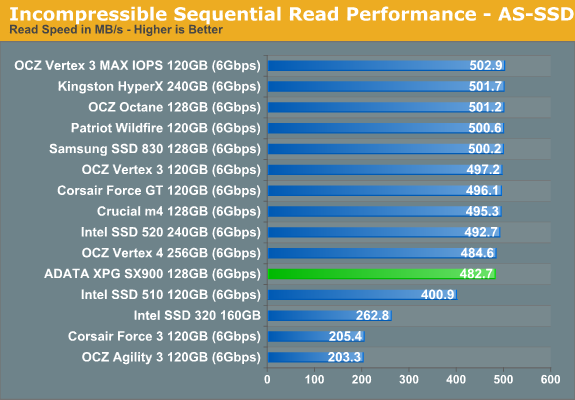
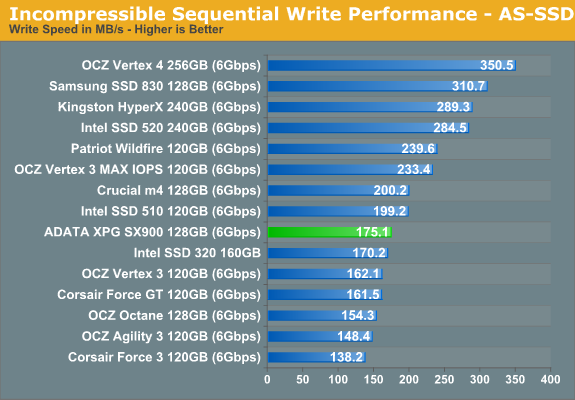
No real surprises here. The SX900 is slightly faster than the 120GB OCZ Vertex 3 and Corsair Force GT, but this is most likely due to a newer firmware version (it's been a while since we tested Vertex 3 and Force GT). As you may have noticed, NAND plays a big role in SandForce incompressible performance. 240GB Kingston HyperX and Intel SSD 520 are the fastest, followed by 120GB Patriot Wildfire and OCZ Vertex 3 MAX IOPS, both of which utilize 3Xnm NAND. 3Xnm MLC NAND die tops out at 4GB, which means the Wildfire and Vertex 3 MAX IOPS have twice as many NAND dies as 120GB SSDs using 2Xnm MLC NAND. That gives them the benefit of interleaving.
AnandTech Storage Bench 2011
Last year we introduced our AnandTech Storage Bench, a suite of benchmarks that took traces of real OS/application usage and played them back in a repeatable manner. Anand assembled the traces out of frustration with the majority of what we have today in terms of SSD benchmarks.
Although the AnandTech Storage Bench tests did a good job of characterizing SSD performance, they weren't stressful enough. All of the tests performed less than 10GB of reads/writes and typically involved only 4GB of writes specifically. That's not even enough exceed the spare area on most SSDs. Most canned SSD benchmarks don't even come close to writing a single gigabyte of data, but that doesn't mean that simply writing 4GB is acceptable.
Originally we kept the benchmarks short enough that they wouldn't be a burden to run (~30 minutes) but long enough that they were representative of what a power user might do with their system. Later, however, we created what we refer to as the Mother of All SSD Benchmarks (MOASB). Rather than only writing 4GB of data to the drive, this benchmark writes 106.32GB. This represents the load you'd put on a drive after nearly two weeks of constant usage. And it takes a long time to run.
1) The MOASB, officially called AnandTech Storage Bench 2011—Heavy Workload, mainly focuses on the times when your I/O activity is the highest. There is a lot of downloading and application installing that happens during the course of this test. Our thinking was that it's during application installs, file copies, downloading, and multitasking with all of this that you can really notice performance differences between drives.
2) We tried to cover as many bases as possible with the software incorporated into this test. There's a lot of photo editing in Photoshop, HTML editing in Dreamweaver, web browsing, game playing/level loading (Starcraft II and WoW are both a part of the test), as well as general use stuff (application installing, virus scanning). We included a large amount of email downloading, document creation, and editing as well. To top it all off we even use Visual Studio 2008 to build Chromium during the test.
The test has 2,168,893 read operations and 1,783,447 write operations. The IO breakdown is as follows:
| AnandTech Storage Bench 2011—Heavy Workload IO Breakdown | ||||
| IO Size | % of Total | |||
| 4KB | 28% | |||
| 16KB | 10% | |||
| 32KB | 10% | |||
| 64KB | 4% | |||
Only 42% of all operations are sequential; the rest ranges from pseudo to fully random (with most falling in the pseudo-random category). Average queue depth is 4.625 IOs, with 59% of operations taking place in an IO queue of 1.
Many of you have asked for a better way to really characterize performance. Simply looking at IOPS doesn't really say much. As a result we're going to be presenting Storage Bench 2011 data in a slightly different way. We'll have performance represented as Average MB/s, with higher numbers being better. At the same time we'll be reporting how long the SSD was busy while running this test. These disk busy graphs will show you exactly how much time was shaved off by using a faster drive vs. a slower one during the course of this test. Finally, we will also break out performance into reads, writes, and combined. The reason we do this is to help balance out the fact that this test is unusually write intensive, which can often hide the benefits of a drive with good read performance.
There's also a new light workload for 2011. This is a far more reasonable, typical every day use case benchmark. It has lots of web browsing, photo editing (but with a greater focus on photo consumption), video playback, as well as some application installs and gaming. This test isn't nearly as write intensive as the MOASB but it's still multiple times more write intensive than what we were running last year.
We don't believe that these two benchmarks alone are enough to characterize the performance of a drive, but hopefully along with the rest of our tests they will help provide a better idea. The testbed for Storage Bench 2011 has changed as well. We're now using a Sandy Bridge platform with full 6Gbps support for these tests.
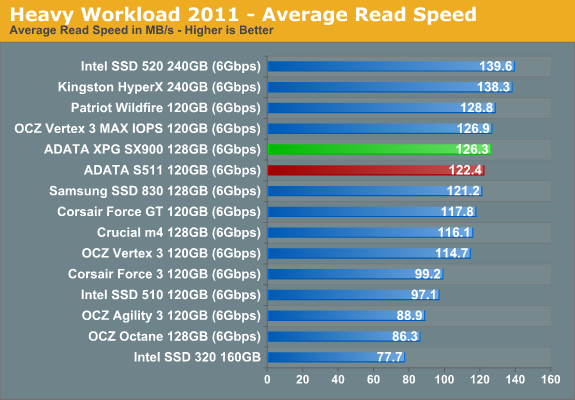
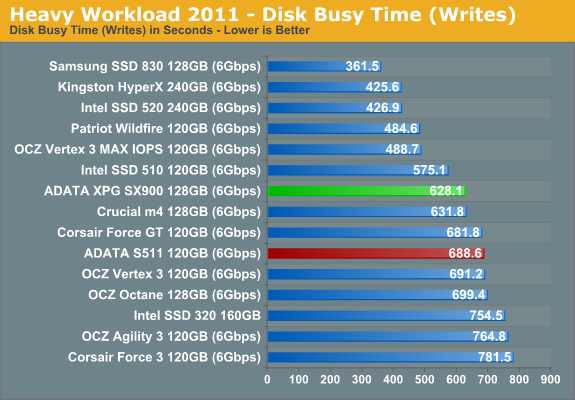
AnandTech Storage Bench 2011 - Heavy Workload
We'll start out by looking at average data rate throughout our new heavy workload test:
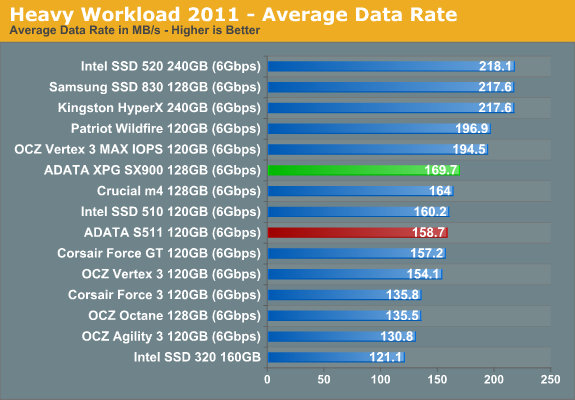
The SX900 is slightly faster than the Vertex 3 and Force GT here, which is most likely due to the newer firmware as I noted in the incompressible sequential read/write speed section. I asked Anand to test a 120GB ADATA S511, which is based on the same SF-2281 controller and utilizes 25nm Intel MLC NAND. The SX900 and S511 should be as similar as possible; however, they don't share the same firmware version. The SX900 is reported to have firmware version 5.0.1 in Device Manager, whereas the S511 Anand tested was running 3.2.2. That's the most current firmware for the S511 and it dates back to November 2011, so this is likely the reason for the difference in performance.
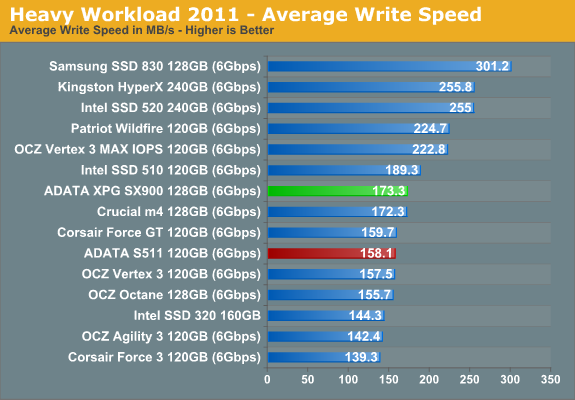
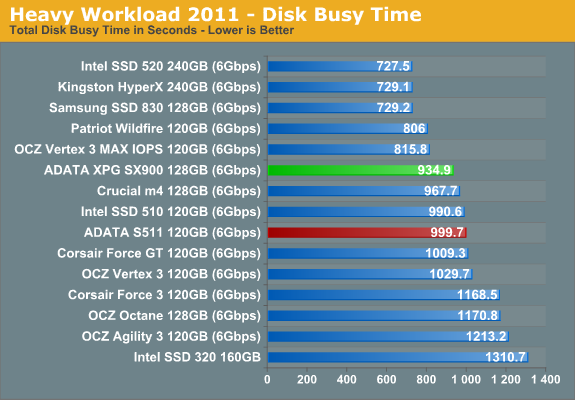
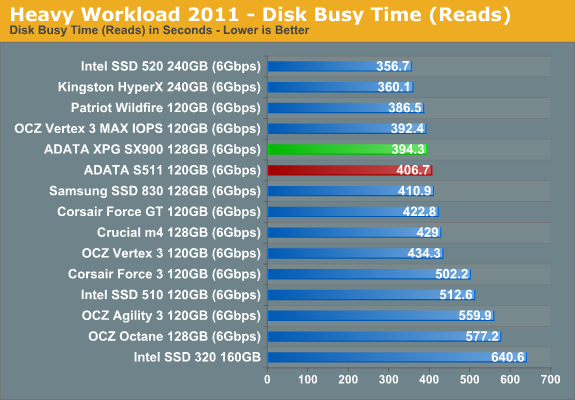
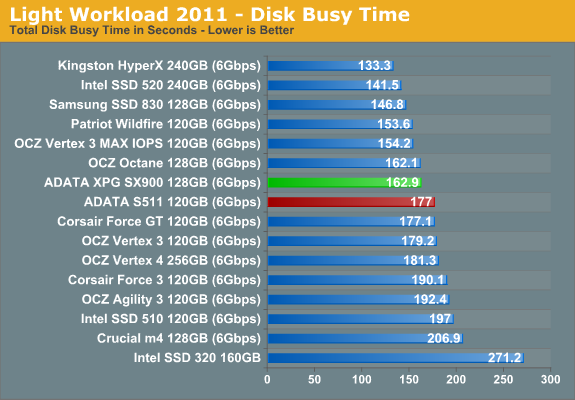
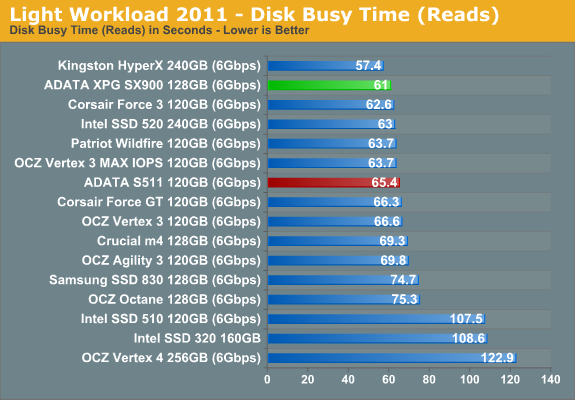
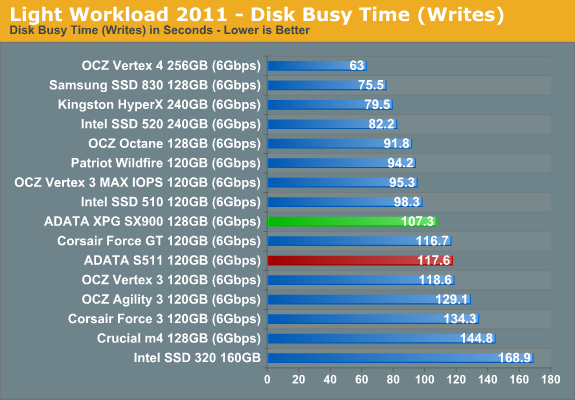
The next three charts just represent the same data, but in a different manner. Instead of looking at average data rate, we're looking at how long the disk was busy for during this entire test. Note that disk busy time excludes any and all idles, this is just how long the SSD was busy doing something:
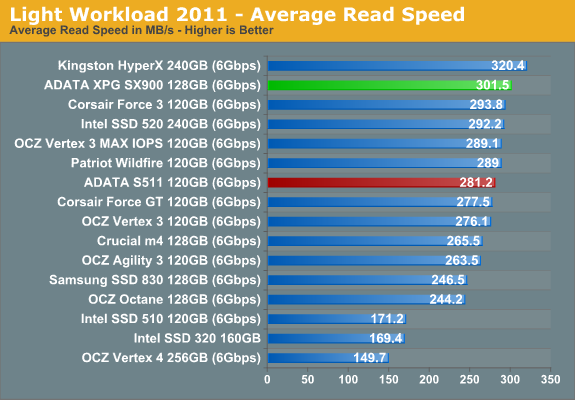
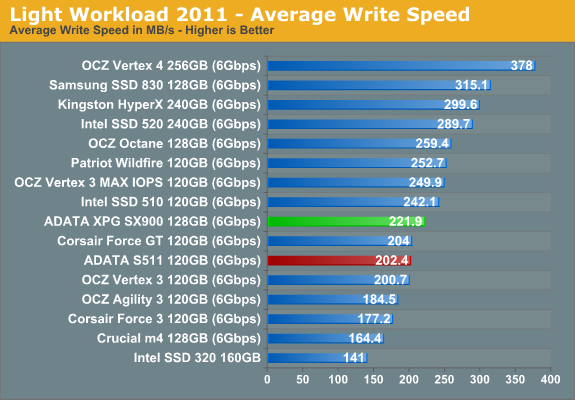
AnandTech Storage Bench 2011—Light Workload
Our new light workload actually has more write operations than read operations. The split is as follows: 372,630 reads and 459,709 writes. The relatively close read/write ratio does better mimic a typical light workload (although even lighter workloads would be far more read centric). The I/O breakdown is similar to the heavy workload at small IOs, however you'll notice that there are far fewer large IO transfers:
| AnandTech Storage Bench 2011—Light Workload IO Breakdown | ||||
| IO Size | % of Total | |||
| 4KB | 27% | |||
| 16KB | 8% | |||
| 32KB | 6% | |||
| 64KB | 5% | |||
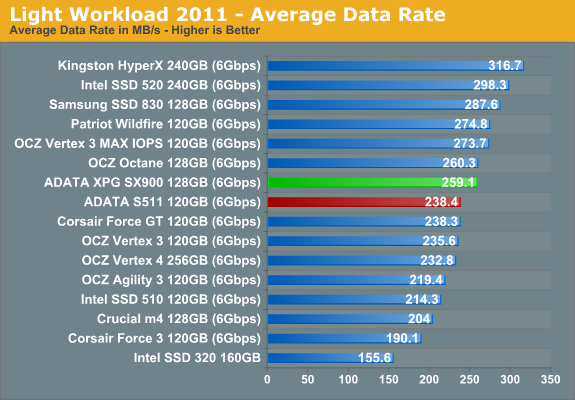
The difference in performance between the SX900 and S511 might seem bigger in our Light Suite, but in terms of percentages it's about the same (the SX900 is 7% faster in our Heavy Suite and 8.7% faster in our Light Suite). Overall performance for the SX900 continues to be similar to other 120/128GB SF-2281 based drives, with firmware and NAND differences causing minor differences in raw performance. In practice, most home users would be hard pressed to notice the difference between the fastest and slowest of these SSDs in day-to-day use.
Performance Over Time and TRIM
Usually we use HD Tach to test TRIM performance but since SandForce drives do real-time compression, using HD Tach and compressible data would not give us a good idea of worst case performance. Instead, I filled the drive with incompressible data and proceeded to hammer it with incompressible 4KB random writes (QD32) for 60 minutes. Then I ran AS-SSD which uses incompressible data as well to see how the SX900 performs in worst case state. Finally I TRIMed the drive and ran AS-SSD again to test whether TRIM recovers the performance.
| ADATA XPG SX900 - Resiliency - AS SSD Sequential Write Speed - 6Gbps | |||
| Clean | After Torture | After TRIM | |
| ADATA XPG SX900 128GB | 175.4MB/s | 35.4MB/s | 146.8MB/s |
| ADATA S511 120GB | 160.8MB/s | 96.4MB/s | 98.8MB/s |
There is quite a big difference between the two ADATA drives when it comes to TRIM and post-torture performance. The S511 performs much better after torture but TRIM is not very effective. The SX900, on the other hand, is the complete opposite. Its performance is poor after torture but a single TRIM pass will almost restore the performance back to clean state, as after TRIM the performance is back to 84% of clean performance. The S511 is definitely an odd case because for example OCZ Vertex 3 behaves similarly with the SX900. However, the important part is that TRIM is able to restore the performance, which is what matters. Firmware is the apparent culprit once again, and it's unfortunate that the S511 hasn't been updated in quite some time.
Again, what I would like to emphasize that our torture scenario is an extreme case. In the real world, it's impossible to create a such scenario if you are using the SSD as a boot drive. That's because you will at least have Windows or some other easily compressible OS on the drive. Even if the drive was used as a storage drive, it's still fairly unlikely that you would fill it with incompressible data only, and what's more it is highly unlikely that a majority of your writes would be random in nature.
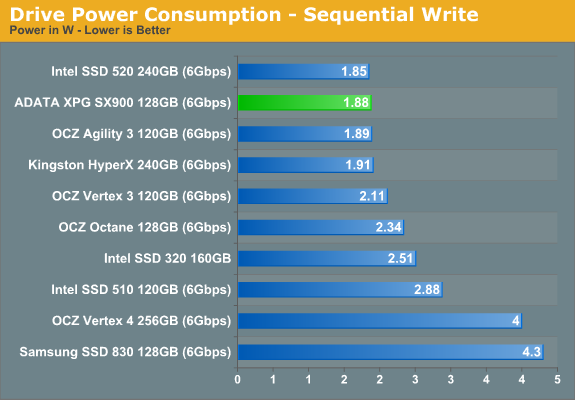
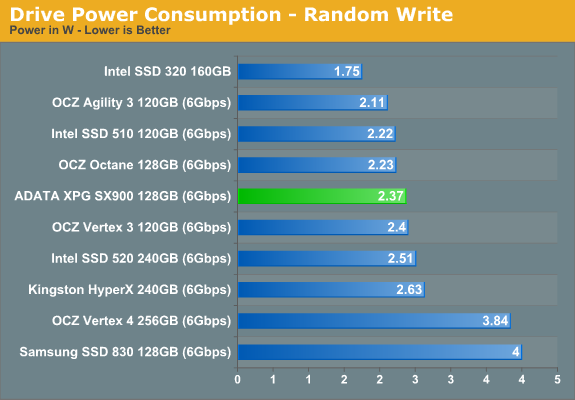
Power Consumption
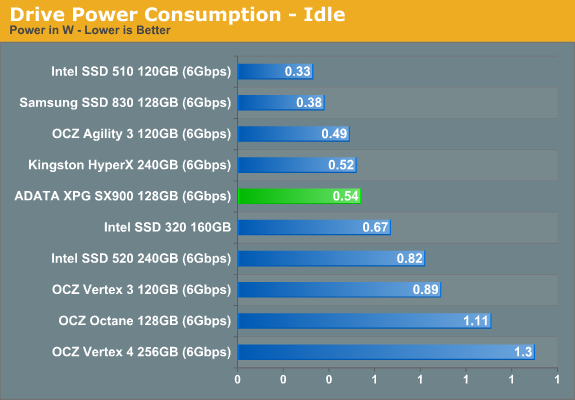
The SX900 uses about as much power as Kingston's HyperX, which puts it in-line with rest of the SF-2281 SSDs. There is a slight difference between SX900 and HyperX in random write power consumption, but keep in mind that the HyperX has twice as many NAND dies as well as RAISE. For desktop use, the difference in power requirements shouldn't matter much, but laptop users will likely want one of the lower power options (e.g. Intel 510 or Samsung 830).
Final Words
If you've seen one SF-2281 drive with synchronous NAND, you've seen them all. From a performance perspective, the ADATA XPG SX900 is as fast as every other SF-2281 SSD with synchronous NAND. The only thing that separates ADATA from the competition is the fact that they have disabled RAISE and hence offer 8GB more capacity than other drives.
Since we are dealing with such similar drives, it all boils down to price. This is where ADATA appears to be making a mistake. With higher capacities than the competition, ADATA's advantage should be lower price per GB, but it's not. Instead, the SX900 series is either more expensive or equivalent to other SF-2281 drives.
The only scenario where I can see ADATA XPG SX900 being better than the rest is if you seriously need or want a SandForce drive with a tiny bit more capacity than the others. However, that's unlikely because if you know you need more than 120GB, then it's likely that 128GB won't suffice either. It's better to buy 180GB or 240GB straightaway so you won't have to deal with a constantly full drive.
In any other case, you will get a better dollar per GB ratio by going with another brand, and on other SF-2281 drives you also get support for RAISE (outside of the 60GB models). While RAISE may sound a bit useless, it's something you won't appreciate unless something goes bad. My feeling is that it's better to have it and not need it than to not have it and need it. It comes down to the importance you place on reliability and data integrity, and right now there's just not enough data to really let us know how non-RAISE SF-2281 will compare over the long haul. Ideally, RAISE would be something that the end-user could trigger on or off depending on one's workload and setup but apparently that is not possible, or at least no manufacturer has offered a tool for that.
At the end of the day the SX900's appeal is determined entirely by price. As noted in the introduction, keeping an eye on SSD prices for at least a few days before pulling the trigger is a good idea because prices fluctuate all the time. If price is a major factor, Crucial's m4 along with the asychronous NAND Mushkin Chronos and OCZ Agility 3 are generally the drives to beat. They may not be the fastest offerings, but unless you really need every last bit of performance, they're still substantially better than any HDD and nearly as good as other offerings.


