Original Link: https://www.anandtech.com/show/10850/the-intel-ssd-600p-512gb-review
The Intel SSD 600p (512GB) Review
by Billy Tallis on November 22, 2016 10:30 AM EST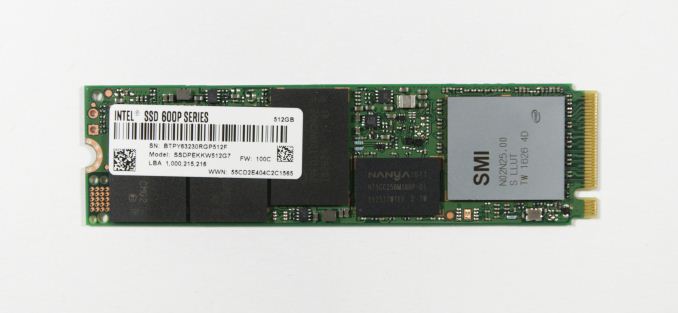
Intel's SSD 600p was the first PCIe SSD using TLC NAND to hit the consumer market. It is Intel's first consumer SSD with 3D NAND and it is by far the most affordable NVMe SSD: current pricing is on par with mid-range SATA SSDs. While most other consumer PCIe SSDs have been enthusiast-oriented products aiming to deliver the highest performance possible, the Intel 600p merely attempts to break the speed limits of SATA without breaking the bank.
The Intel SSD 600p has almost nothing in common with Intel's previous NVMe SSD for consumers (the Intel SSD 750). Where the Intel SSD 750 uses Intel's in-house enterprise SSD controller with consumer-oriented firmware, the Intel 600p uses a third-party controller. The SSD 600p is a M.2 PCIe SSD with peak power consumption only slightly higher than the SSD 750's idle. By comparison, the Intel SSD 750 is a high power and high performance drive that comes in PCIe expansion card and 2.5" U.2 form factors, both with sizable heatsinks.
| Intel SSD 600p Specifications Comparison | |||||
| 128GB | 256GB | 512GB | 1TB | ||
| Form Factor | single-sided M.2 2280 | ||||
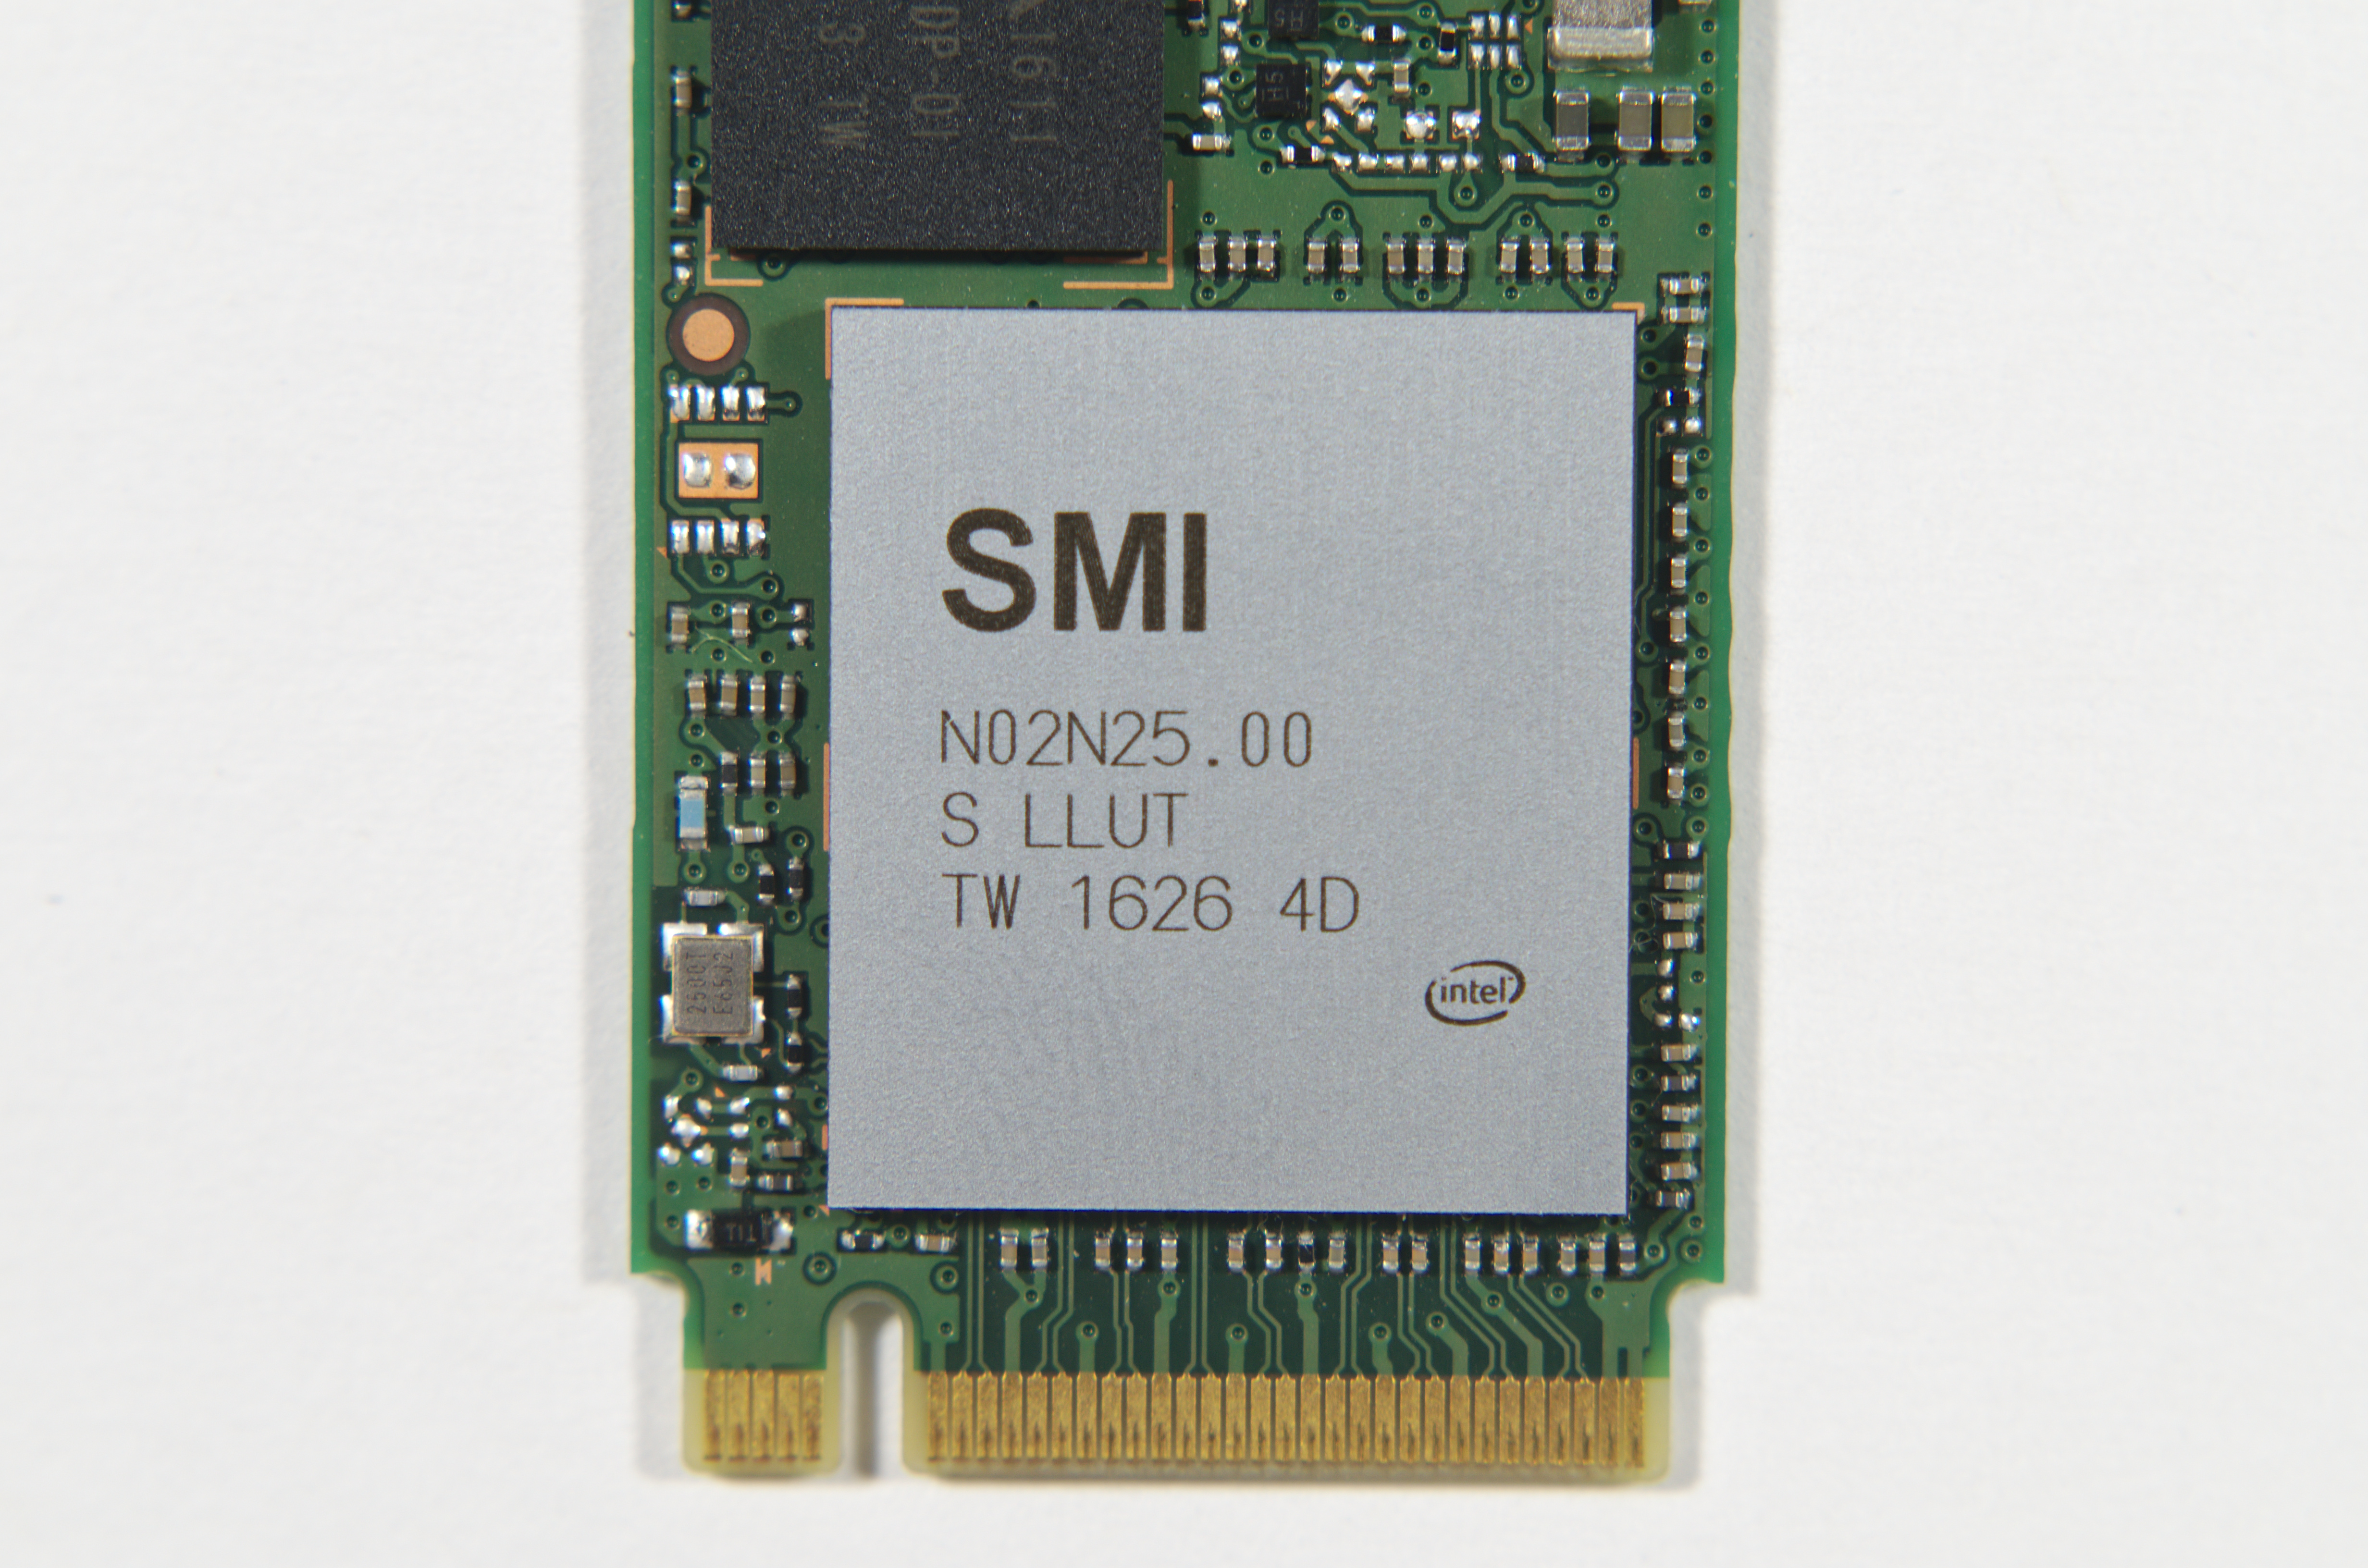
| Controller | Intel-customized Silicon Motion SM2260 | ||||
| Interface | PCIe 3.0 x4 | ||||
| NAND | Intel 384Gb 32-layer 3D TLC | ||||
| SLC Cache Size | 4 GB | 8.5 GB | 17.5 GB | 32 GB | |
| Sequential Read | 770 MB/s | 1570 MB/s | 1775 MB/s | 1800 MB/s | |
| Sequential Write (SLC Cache) | 450 MB/s | 540 MB/s | 560 MB/s | 560 MB/s | |
| 4KB Random Read (QD32) | 35k IOPS | 71k IOPS | 128.5k IOPS | 155k IOPS | |
| 4KB Random Write (QD32) | 91.5k IOPS | 112k IOPS | 128k IOPS | 128k IOPS | |
| Endurance | 72 TBW | 144 TBW | 288 TBW | 576 TBW | |
| Warranty | 5 years | ||||
The Intel SSD 600p is our first chance to test Silicon Motion's SM2260 controller, their first PCIe SSD controller. Silicon Motion's SATA SSD controllers have built a great reputation for being affordable, low power and providing good mainstream performance. One key to the power efficiency of Silicon Motion's SATA SSD controllers is their use of an optimized single core ARC processor (via Synopsys), but in order to meet the SM2260's performance target, Silicon Motion has finally switched to a dual core ARM processor. The controller chip used on the SSD 600p has some customizations specifically for Intel and bears both Intel and SMI logos.
The 3D TLC NAND used on the Intel SSD 600p is the first generation 3D NAND co-developed with Micron. We've already evaluated Micron's Crucial MX300 with the same 3D TLC and found it to be a great mainstream SATA SSD. The MX300 was unable to match the performance of Samsung's 3D TLC NAND as found in the 850 EVO, but the MX300 is substantially cheaper and remarkably power efficient, both in comparison to Samsung's SSDs and to other SSDs that use the same controller as the MX300 but planar NAND.
Intel uses the same 3D NAND flash die for its MLC and TLC parts. The MLC configuration that has not yet found its way to the consumer SSD market has a capacity of 256Gb (32GB) per die, which gives the TLC configuration a capacity of 384Gb (48GB). Micron took advantage of this odd size to offer the MX300 in non-standard capacities, but for the SSD 600p Intel is offering normal power of two capacities with large fixed size SLC write caches in the spare area. The ample spare area also allows for a write endurance rating of about 0.3 drive writes per day for the duration of the five year warranty.
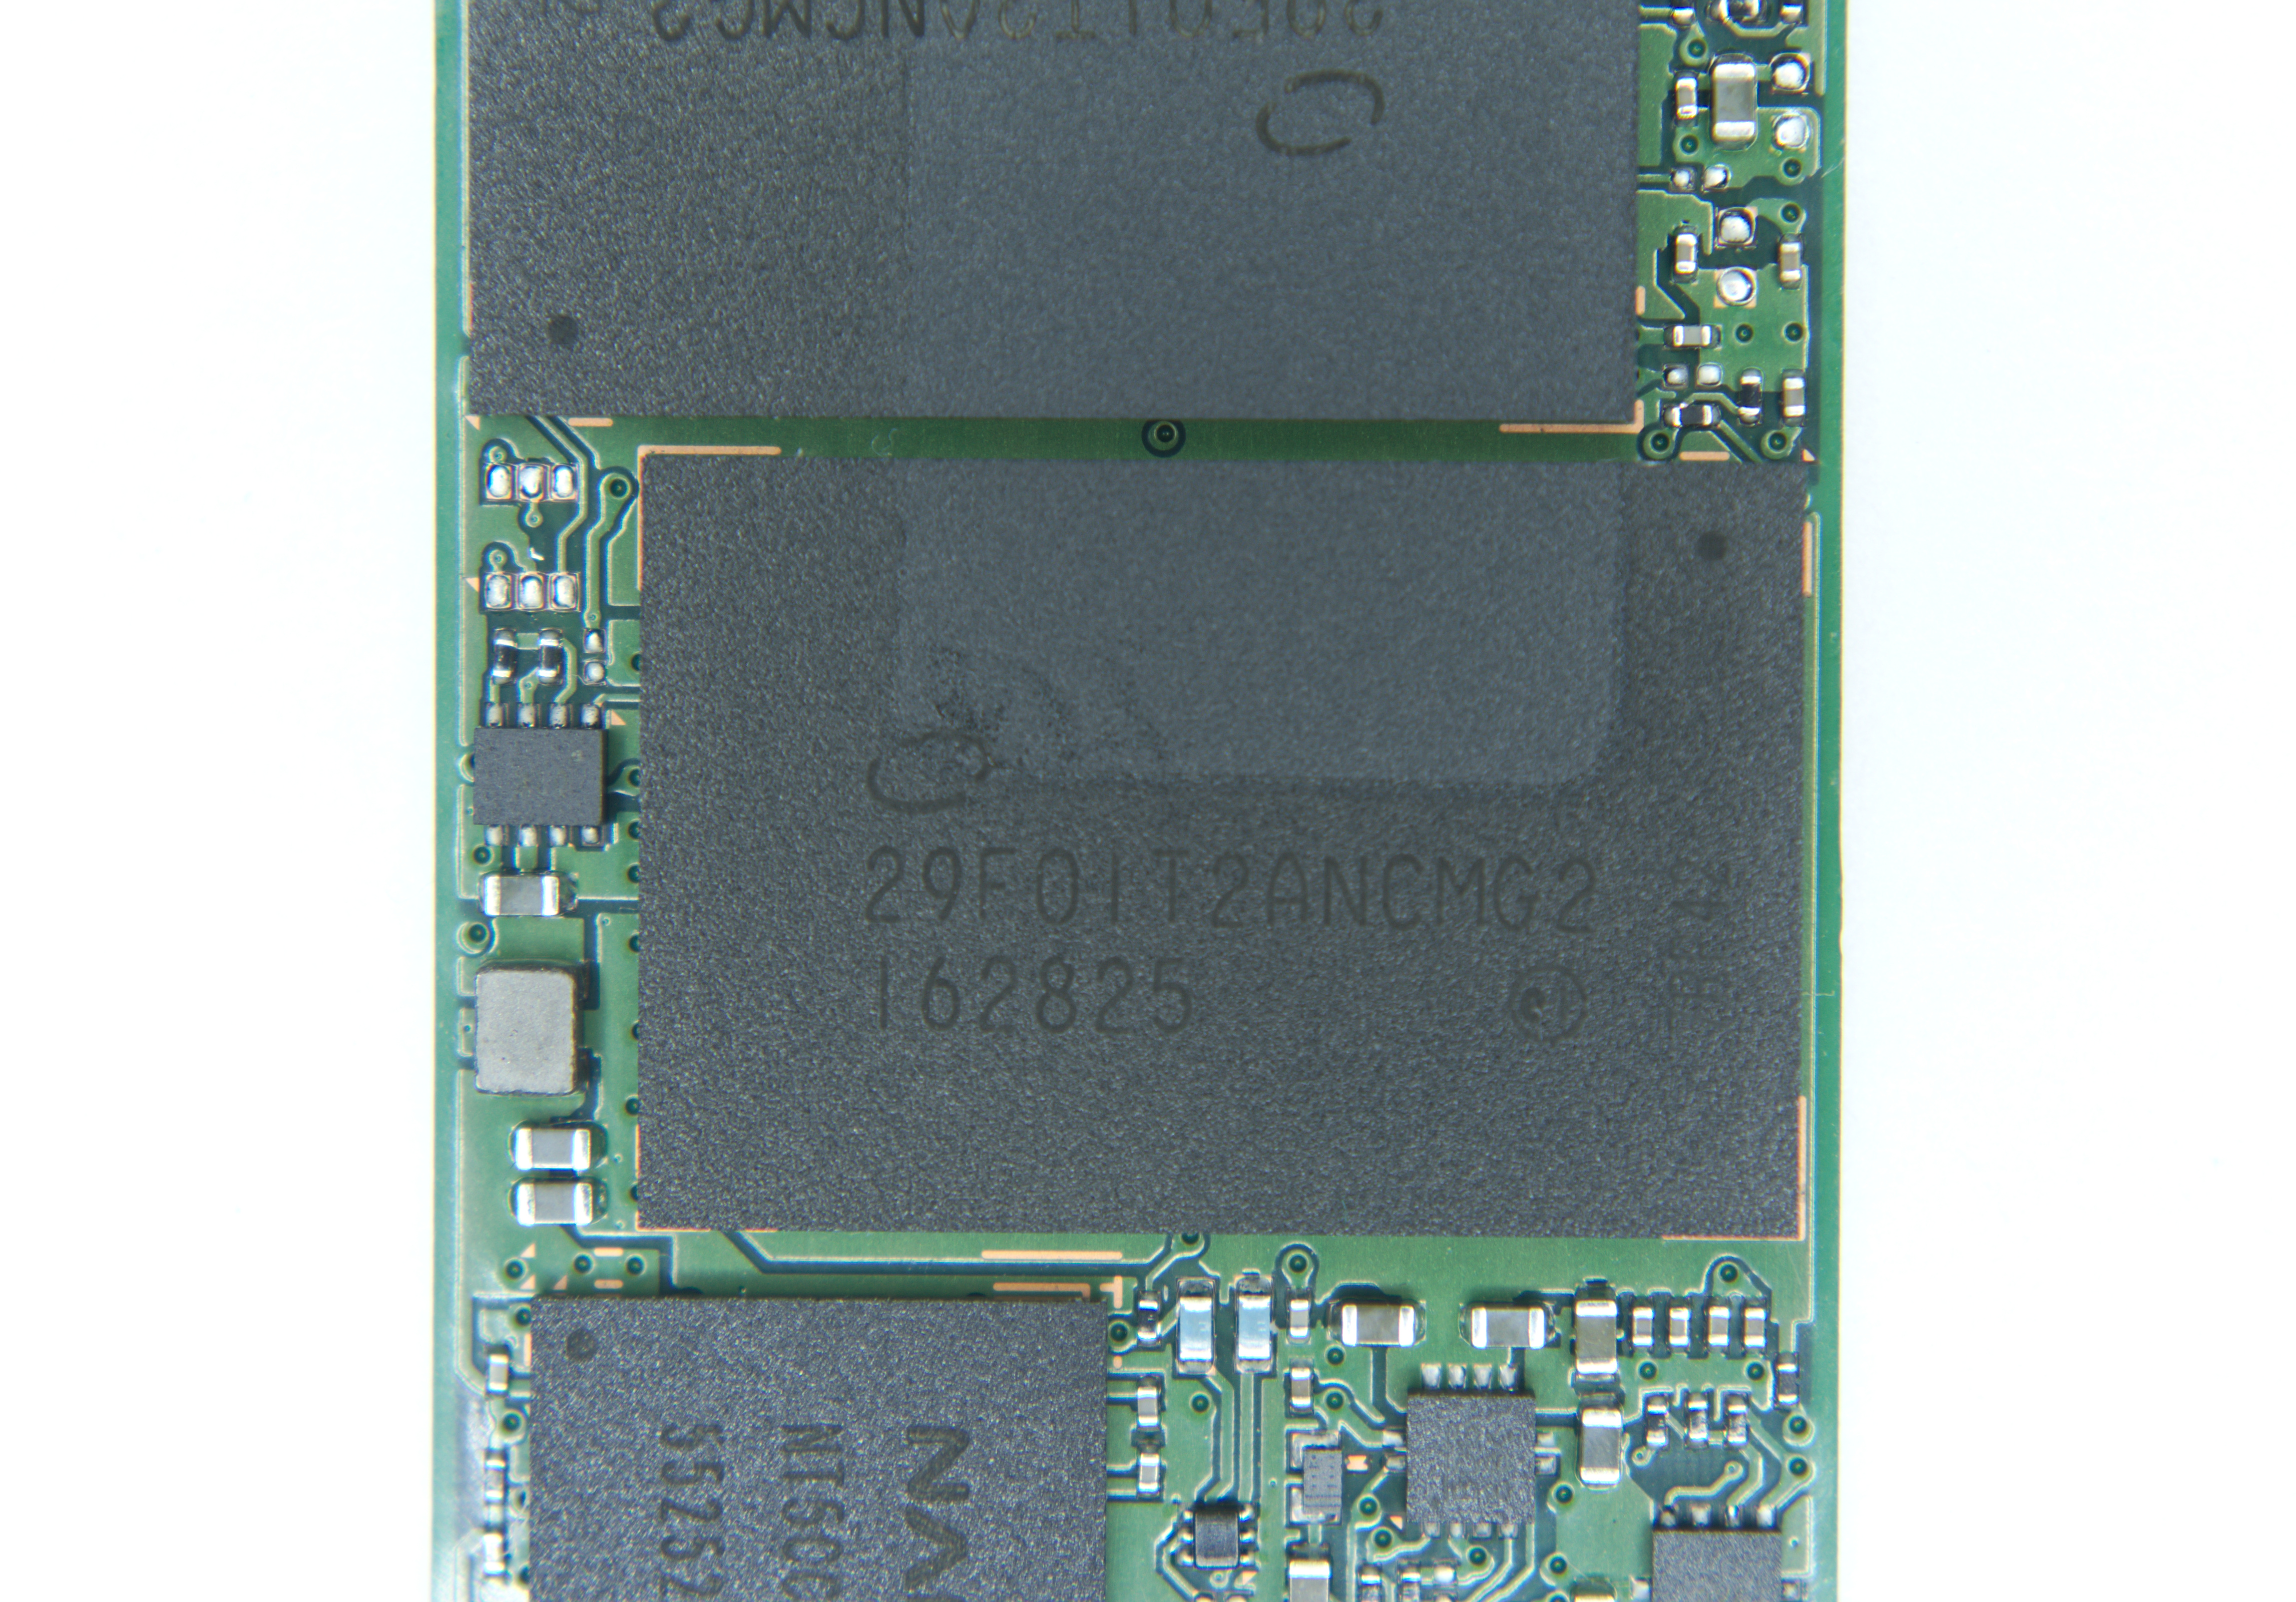
Intel 3D TLC NAND, four 48GB dies for a total of 192GB per package
The Intel SSD 600p shares its hardware with two other Intel products: the SSD Pro 6000p for business client computing and the SSD E 6000p for the embedded and IoT market. The Pro 6000p is the only one of the three to support encryption and Intel's vPro security features. The SSD 600p relies on the operating system's built-in NVMe driver and Intel's consumer SSD Toolbox software which was updated in October to support the 600p.
For this review, the primary comparisons will not be against high-end NVMe drives but against mainstream SATA SSDs, as these are ultimately the closest to 'mid-to-low range' NVMe as we can get. The Crucial MX300 has given us a taste of what the Intel/Micron 3D TLC can do, and it is currently one of the best value SSDs on the market. The Samsung 850 EVO is very close to the Intel SSD 600p in price and sets the bar for the performance the SSD 600p needs to provide in order to be a good value.
Because the Intel SSD 600p is targeting a more mainstream audience and more modest level of performance than most other M.2 PCIe SSDs, I have additionally tested its performance in the M.2 slot built in to the testbed's ASUS Z97 Pro motherboard. In this configuration the SSD 600p is limited to a PCIe 2.0 x2 link, as compared to the PCIe 3.0 x4 link that is available during the ordinary testing process where an adapter is used in the primary PCIe x16 slot. This extra set of results does not include power measurements but may be more useful to desktop users who are considering adding a cheap NVMe SSD to an older but compatible existing system.
| AnandTech 2015 SSD Test System | |
| CPU | Intel Core i7-4770K running at 3.5GHz (Turbo & EIST enabled, C-states disabled) |
| Motherboard | ASUS Z97 Pro (BIOS 2701) |
| Chipset | Intel Z97 |
| Memory | Corsair Vengeance DDR3-1866 2x8GB (9-10-9-27 2T) |
| Graphics | Intel HD Graphics 4600 |
| Desktop Resolution | 1920 x 1200 |
| OS | Windows 8.1 x64 |
- Thanks to Intel for the Core i7-4770K CPU
- Thanks to ASUS for the Z97 Deluxe motherboard
- Thanks to Corsair for the Vengeance 16GB DDR3-1866 DRAM kit, RM750 power supply, Carbide 200R case, and Hydro H60 CPU cooler
Performance Consistency
Our performance consistency test explores the extent to which a drive can reliably sustain performance during a long-duration random write test. Specifications for consumer drives typically list peak performance numbers only attainable in ideal conditions. The performance in a worst-case scenario can be drastically different as over the course of a long test drives can run out of spare area, have to start performing garbage collection, and sometimes even reach power or thermal limits.
In addition to an overall decline in performance, a long test can show patterns in how performance varies on shorter timescales. Some drives will exhibit very little variance in performance from second to second, while others will show massive drops in performance during each garbage collection cycle but otherwise maintain good performance, and others show constantly wide variance. If a drive periodically slows to hard drive levels of performance, it may feel slow to use even if its overall average performance is very high.
To maximally stress the drive's controller and force it to perform garbage collection and wear leveling, this test conducts 4kB random writes with a queue depth of 32. The drive is filled before the start of the test, and the test duration is one hour. Any spare area will be exhausted early in the test and by the end of the hour even the largest drives with the most overprovisioning will have reached a steady state. We use the last 400 seconds of the test to score the drive both on steady-state average writes per second and on its performance divided by the standard deviation.
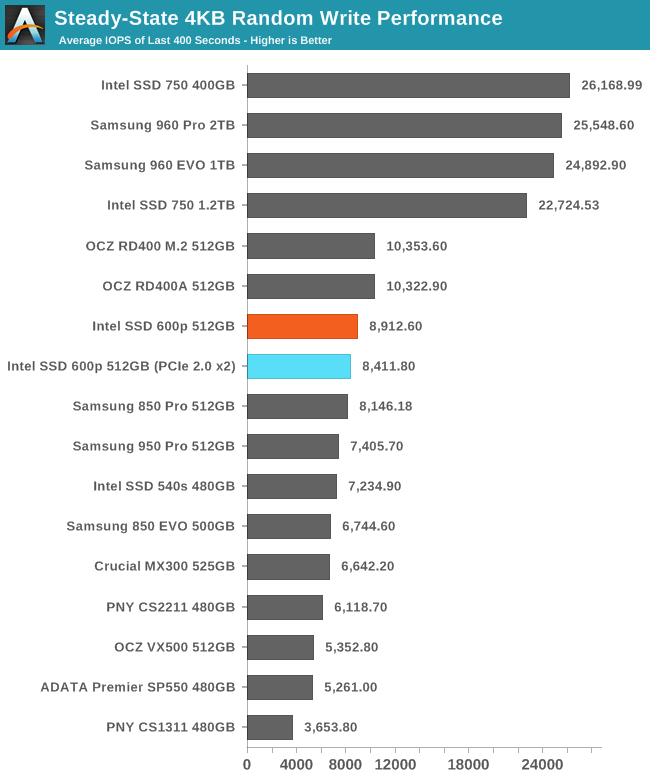
The Intel 600p's steady state random write performance is reasonably fast, especially for a TLC SSD. The 600p is faster than all of the SATA SSDs in this collection. The Intel 750 and Samsung 960s are in an entirely different league, but the OCZ RD400 is only slightly ahead of the 600p.
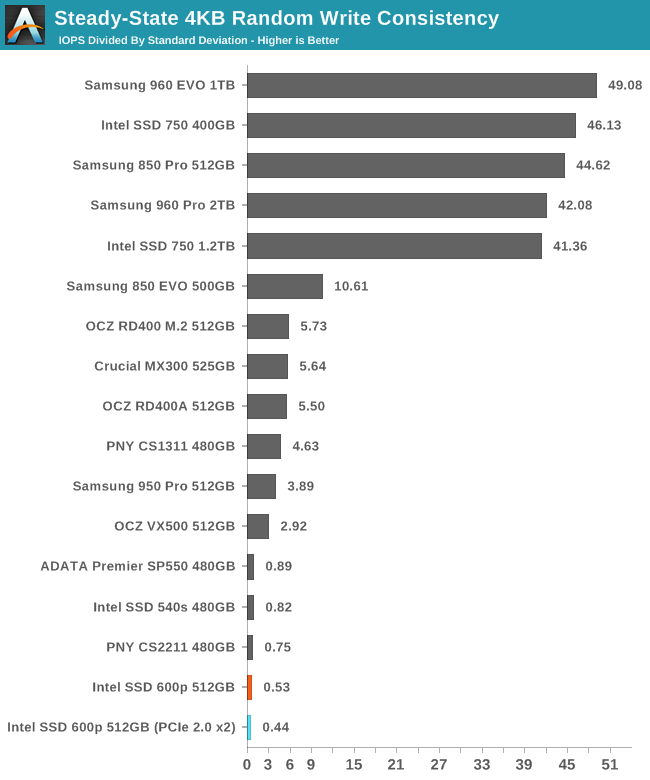
Despite a decently high average performance, the 600p has a very low consistency score, indicating that even after reaching steady state, the performance varies widely and the average does not tell the whole story.
 |
|||||||||
| Default | |||||||||
| 25% Over-Provisioning | |||||||||
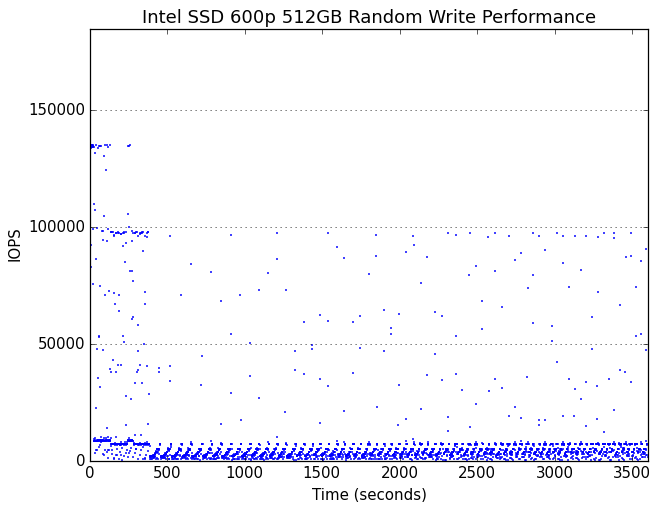
Very early in the test, the 600p begins showing cyclic drops in performance due to garbage collection. Several minutes into the hour-long test, the drive runs out of spare area and reaches steady state.
 |
|||||||||
| Default | |||||||||
| 25% Over-Provisioning | |||||||||
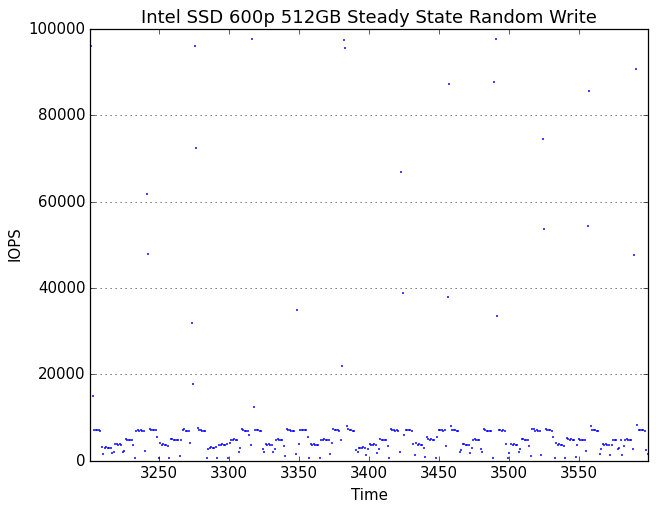
In its steady state, the 600p spends most of the time tracing out a sawtooth curve of performance that has a reasonable average but is constantly dropping down to very low performance levels. Oddly, there are also brief moments of unhindered performance where the drive spikes to exceptionally high performance of up to 100k IOPS, but these are short and infrequent enough to have little impact on the average performance. It would appear that the 600p occasionally frees up some SLC cache, which then immediately gets used up and kicks off another round of garbage collection.
With extra overprovisioning, the 600p's garbage collection cycles don't drag performance down as far, making the periodicity less obvious.
AnandTech Storage Bench - The Destroyer
The Destroyer is an extremely long test replicating the access patterns of very IO-intensive desktop usage. A detailed breakdown can be found in this article. Like real-world usage and unlike our Iometer tests, the drives do get the occasional break that allows for some background garbage collection and flushing caches, but those idle times are limited to 25ms so that it doesn't take all week to run the test.
We quantify performance on this test by reporting the drive's average data throughput, a few data points about its latency, and the total energy used by the drive over the course of the test.
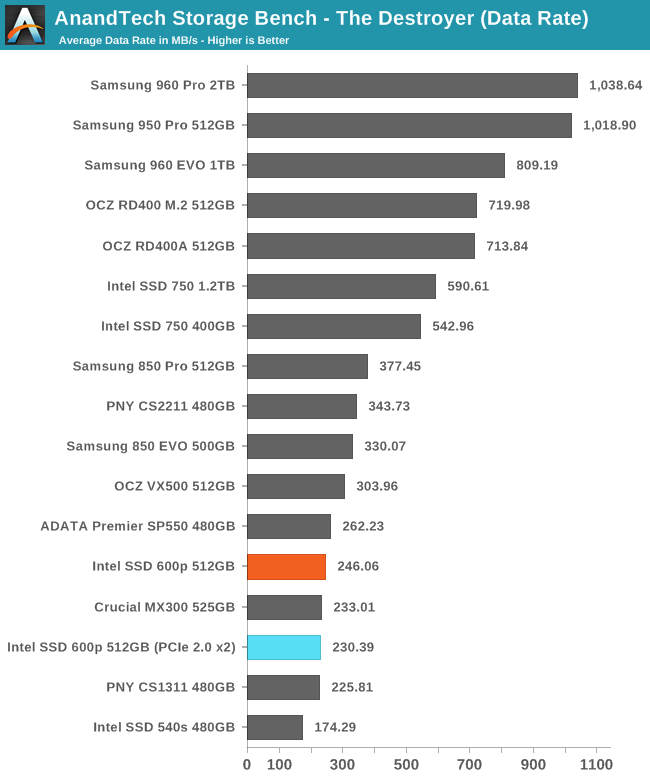
The average data rate sustained by the 600p on The Destroyer shows that the drive is almost entirely limited by the speed of the 3D TLC NAND, and it is barely any faster than the Crucial MX300 that uses the same NAND.
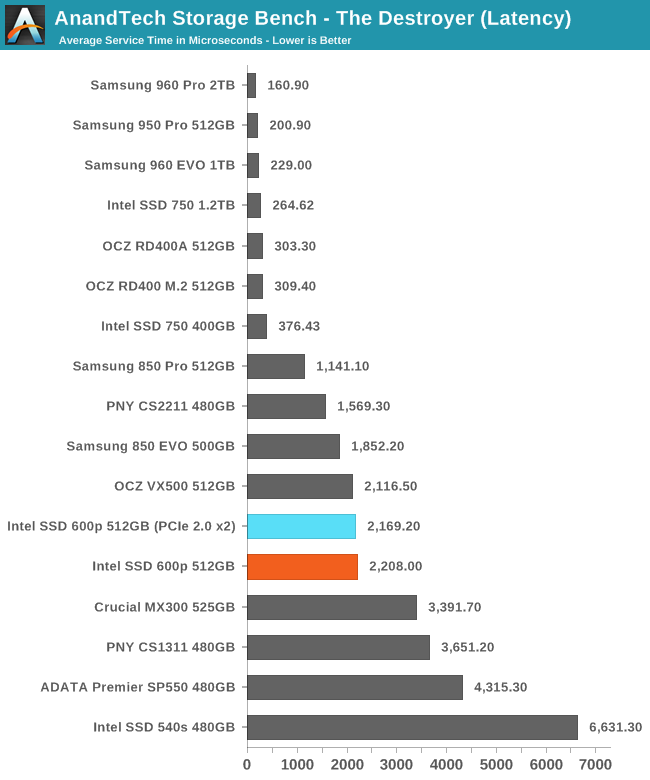
The average service time of the 600p is much lower than most TLC SSDs, so the NVMe PCIe interface is providing some latency benefit even when the drive's throughput doesn't need anything faster than SATA. The 600p is still only as good as a mid-range MLC SATA SSD and doesn't come close to the low latency of high-end NVMe drives.
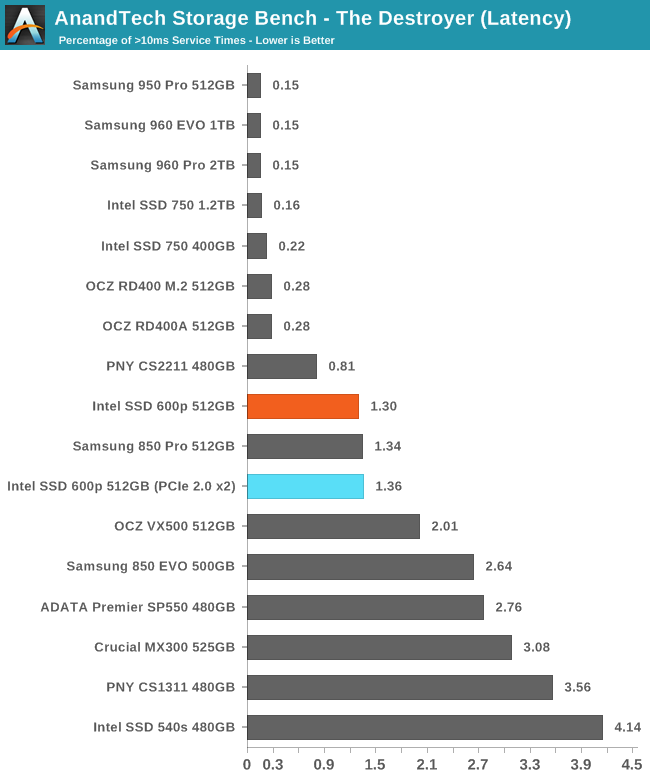
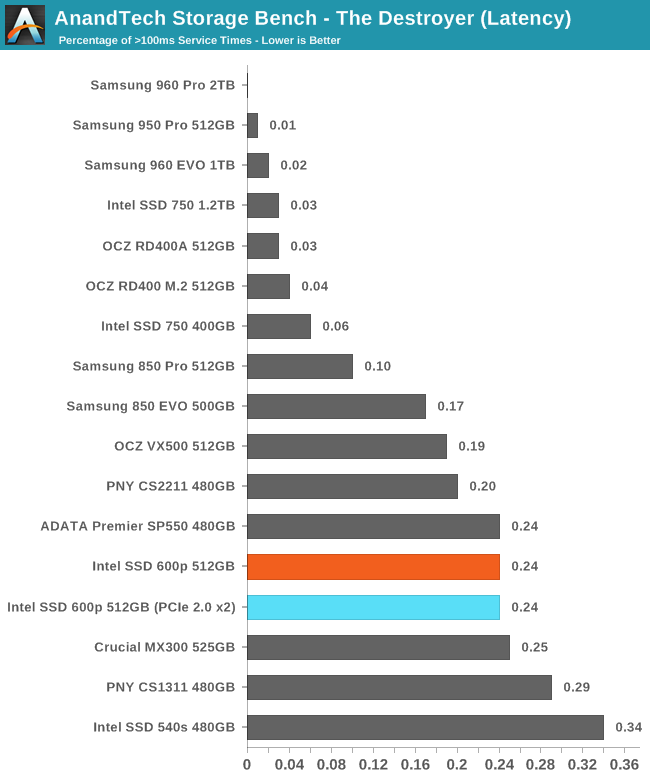
The number of high latency outliers above the 10ms threshold and above 100ms tells two quite different stories. The 600p is as good as most MLC SATA drives at completing most of its operations in under 10ms, but when the drive stalls, it does so as severely as a budget TLC SATA SSD.
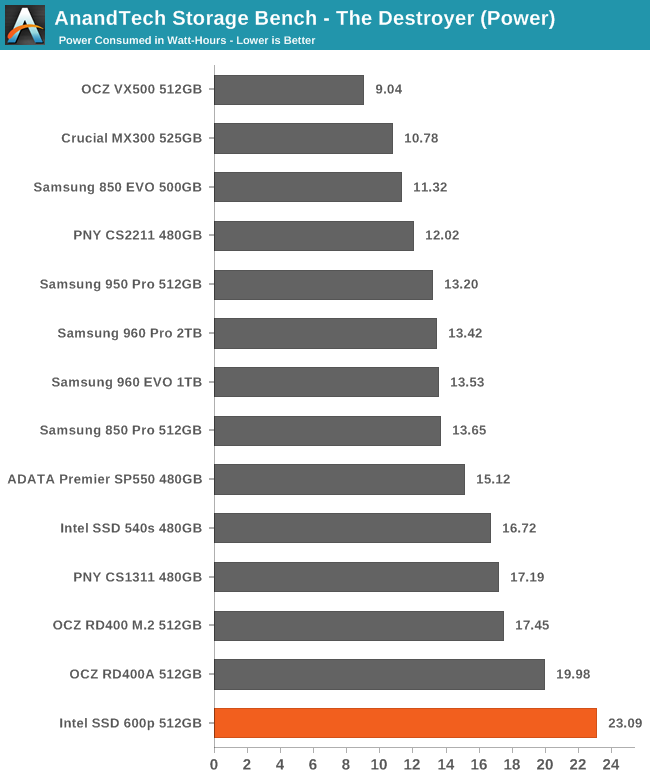
Operating a PCIe 3.0 x4 link requires quite a bit more power than a SATA link, so most PCIe SSDs start at a disadvantage in power consumption and make up for it by completing the test fast enough that the total energy used is not higher than is typical for SATA SSD. The 600p doesn't complete The Destroyer any quicker than a SATA SSD and the 40nm fab process used by the SM2260 controller doesn't do it any favors here either.
AnandTech Storage Bench - Heavy
Our Heavy storage benchmark is proportionally more write-heavy than The Destroyer, but much shorter overall. The total writes in the Heavy test aren't enough to fill the drive, so performance never drops down to steady state. This test is far more representative of a power user's day to day usage, and is heavily influenced by the drive's peak performance. The Heavy workload test details can be found here.
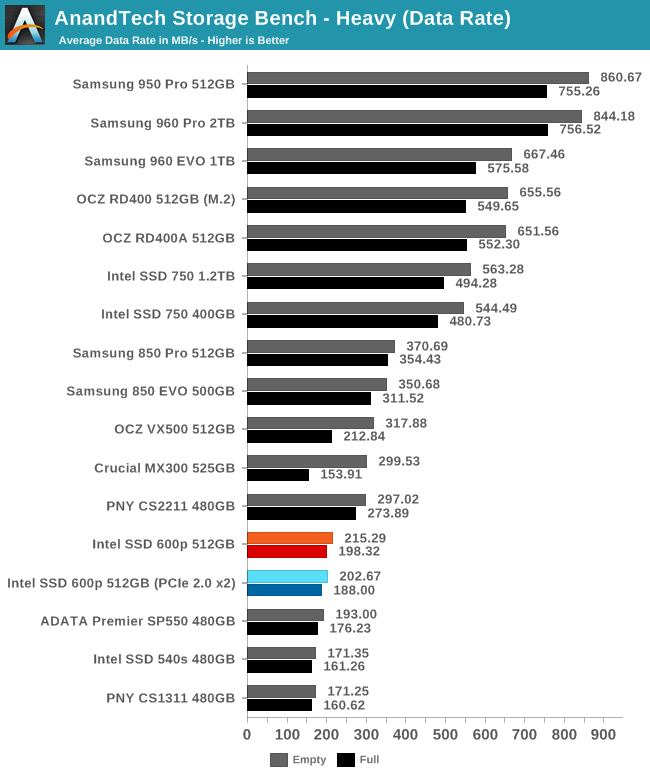
It is quite clear that the 600p takes a very different approach to managing its 3D TLC than the Crucial MX300. The latter performed much better than most TLC drives when the Heavy test was run on an empty drive, but fell to last place when the test was conducted on a full drive. The 600p by contrast performed quite similarly in both scenarios due to its fixed-size SLC cache. Unfortunately, this means the 600p has no significant advantage over budget SATA SSDs on this test.
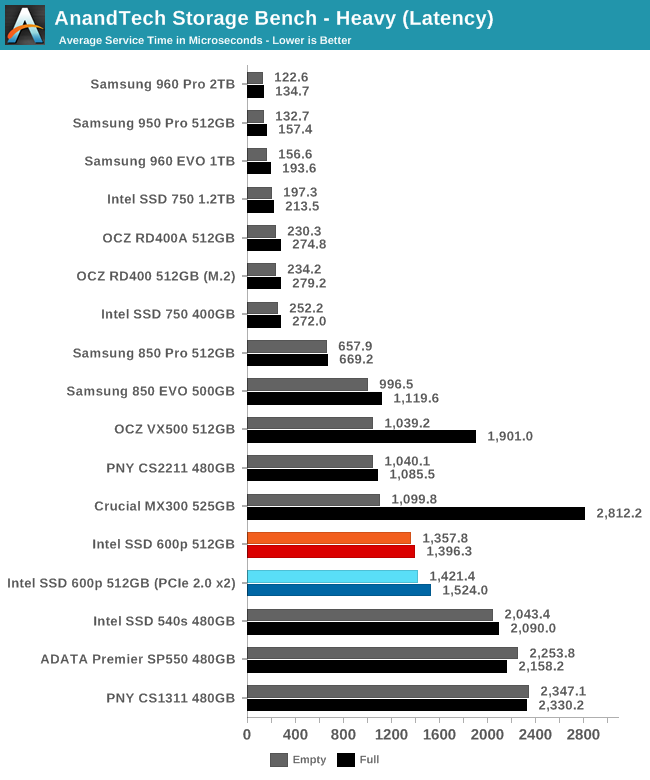
The 600p has lower average service times than the planar TLC SATA SSDs, but it isn't up to the level of the Samsung 850 EVO or MLC SATA SSDs.
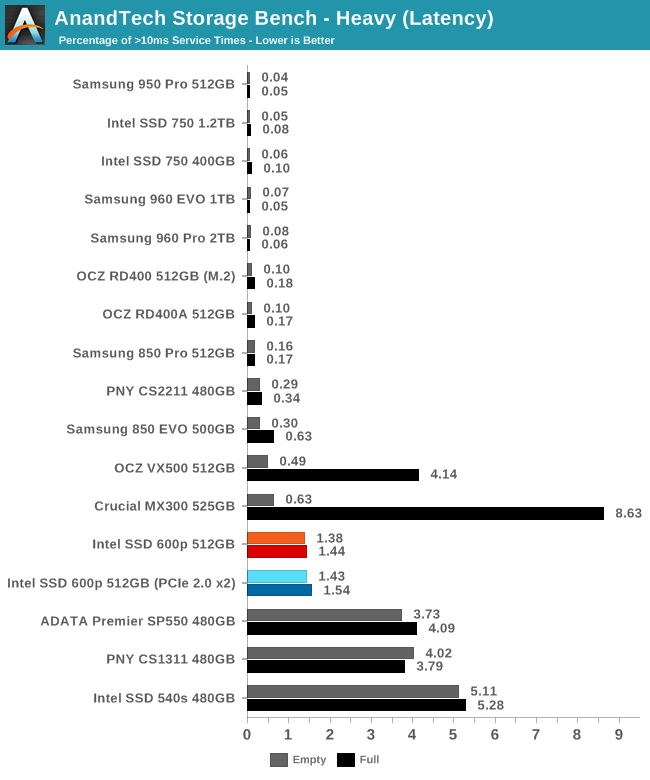
The percentage of high-latency outliers shows that the 600p is in a category of its own, sitting above planar TLC SSDs that get thoroughly bogged down by the write-heavy test but not good enough to be lumped together with MLC SSDs.
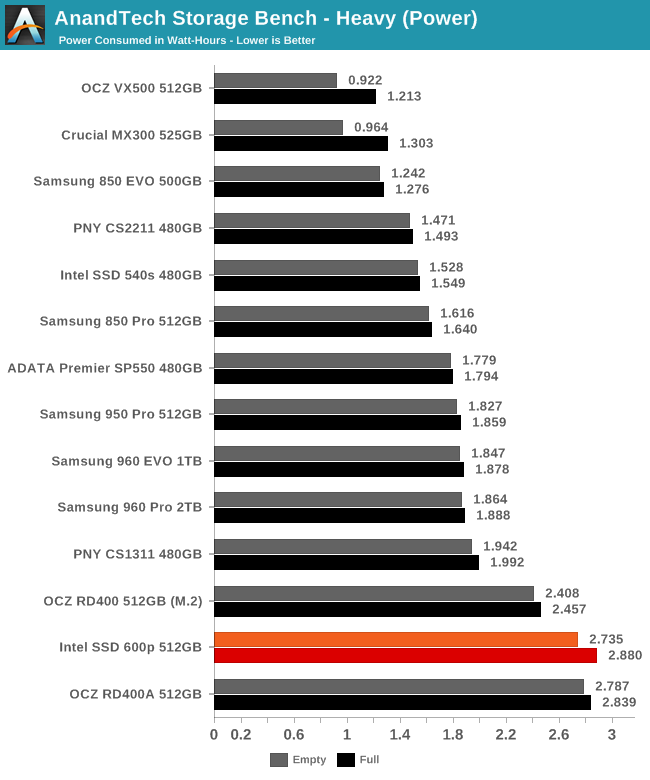
The 600p is less efficient than any M.2 or SATA SSD on this test, and is only matched by the OCZ RD400A because the latter is doing its own 12V to 3.3V conversion instead of drawing directly from the 3.3V supply.
AnandTech Storage Bench - Light
Our Light storage test has relatively more sequential accesses and lower queue depths than The Destroyer or the Heavy test, and it's by far the shortest test overall. It's based largely on applications that aren't highly dependent on storage performance, so this is a test more of application launch times and file load times. This test can be seen as the sum of all the little delays in daily usage, but with the idle times trimmed to 25ms it takes less than half an hour to run. Details of the Light test can be found here.
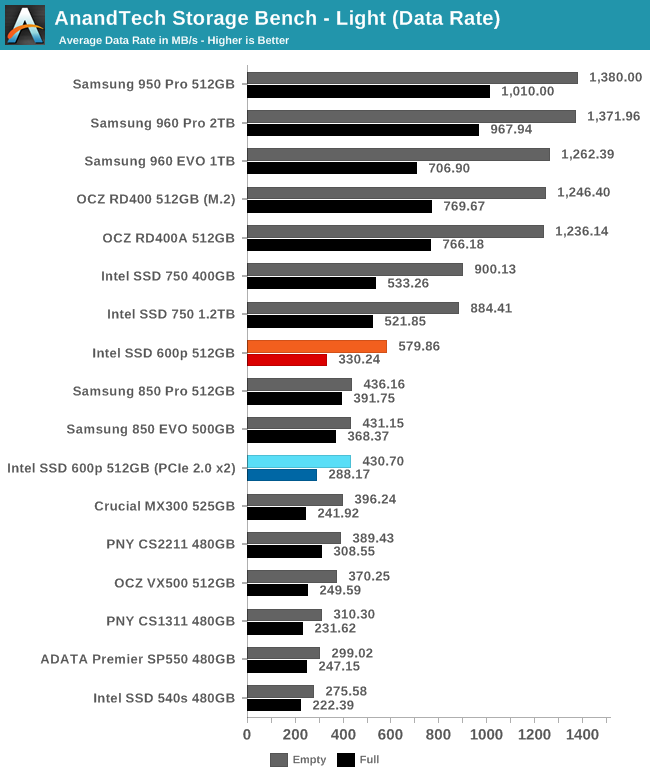
On the Light test we finally see the 600p pull ahead of SATA SSDs, albeit not when the drive is full. This test shows what the 600p can do before it gets overwhelmed by sustained writes, and it's also the first time where the PCIe 2.0 x2 connection is a significant bottleneck.
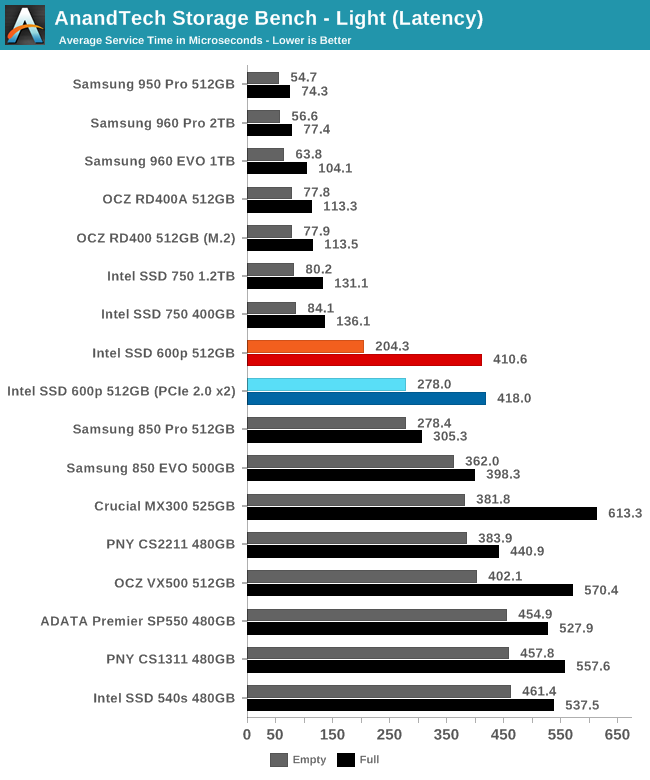
The average service times of the 600p rank about where the should: worse than the other NVMe SSDs, but also better than the SATA drives can manage. When the 600p is full its latency is significantly worse and isn't quite as good as Samsung's SATA SSDs, but it is nothing to complain about.
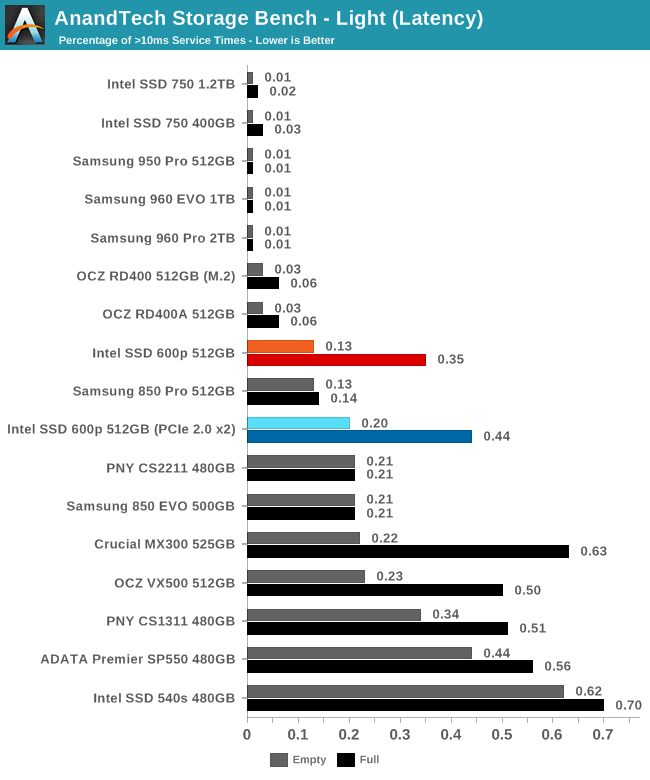
Aside from the usual caveat that it suffers acutely when full, the 600p meets expectations for the number of latency outliers.
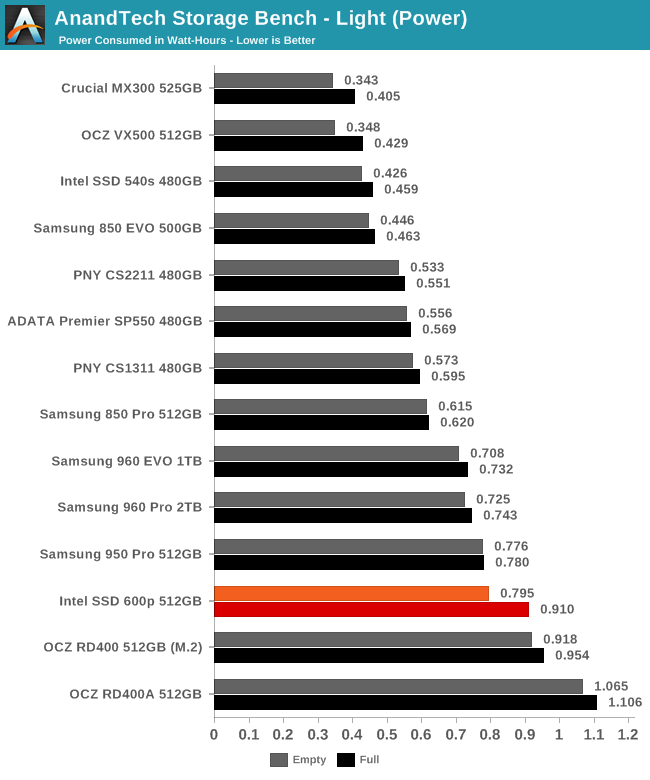
The 600p manages to pull ahead of the OCZ RD400 in power consumption and is close to Samsung's NVMe SSDs in efficiency, but the SATA drives are all significantly more efficient.
Random Read Performance
The random read test requests 4kB blocks and tests queue depths ranging from 1 to 32. The queue depth is doubled every three minutes, for a total test duration of 18 minutes. The test spans the entire drive, which is filled before the test starts. The primary score we report is an average of performances at queue depths 1, 2 and 4, as client usage typically consists mostly of low queue depth operations.
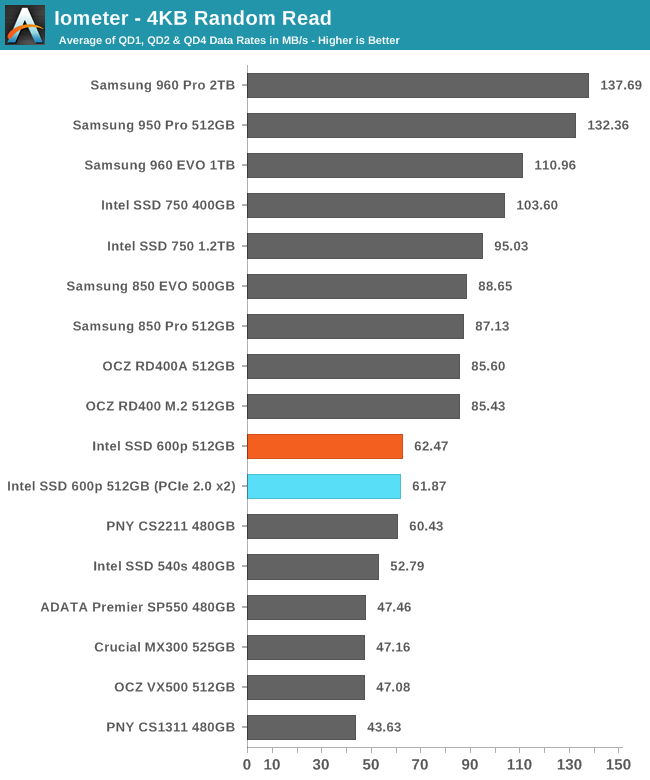
The Intel 600p has faster random reads than budget SATA SSDs, but it is significantly behind the Samsung 850 EVO.
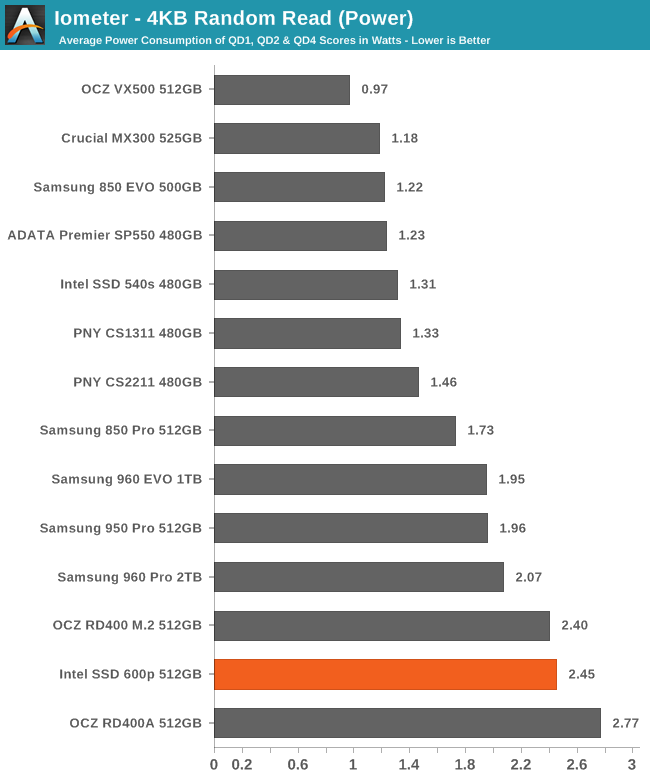
As usual, the 600p's power consumption is high, but not egregiously so: 2.45W is usually not high enough for thermal throttling to be a concern for M.2 SSDs.
 |
|||||||||
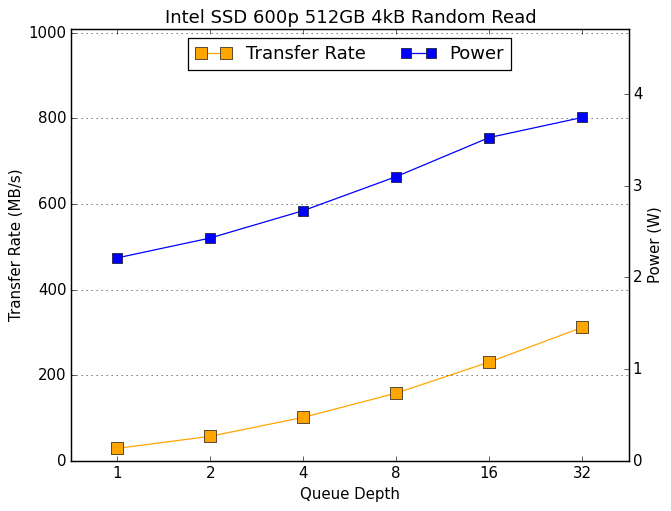
The 600p's performance grows slowly as queue depth increases, and even at QD32 it has not reached the SATA speed limit that Samsung's SATA drives hit at QD16.
Random Write Performance
The random write test writes 4kB blocks and tests queue depths ranging from 1 to 32. The queue depth is doubled every three minutes, for a total test duration of 18 minutes. The test is limited to a 16GB portion of the drive, and the drive is empty save for the 16GB test file. The primary score we report is an average of performances at queue depths 1, 2 and 4, as client usage typically consists mostly of low queue depth operations.
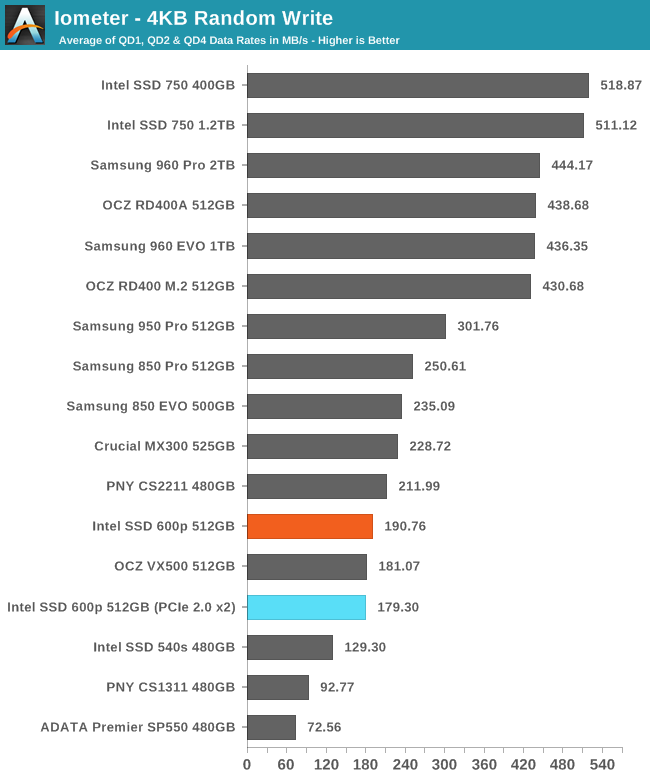
The 600p had above-average steady-state QD32 random write performance, but this shorter test of low queue depths puts the 600p only barely ahead of the slowest MLC SSD in this collection.
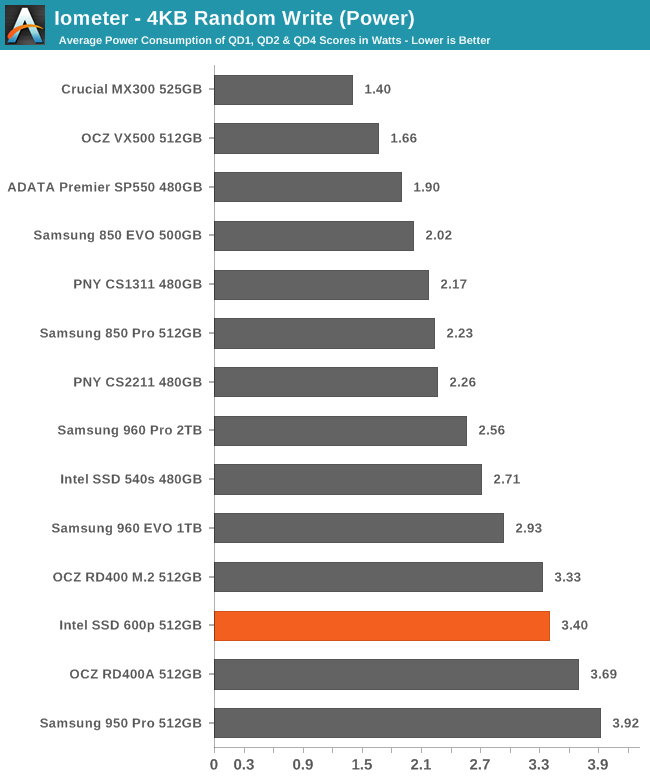
The 600p uses more power than most drives, but unlike the Samsung 950 Pro it isn't brushing up against the practical TDP limits of the M.2 form factor even at lowest queue depths.
 |
|||||||||
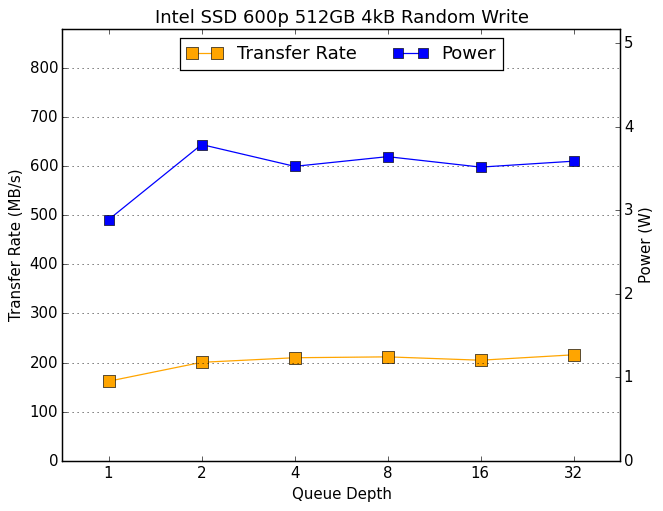
It is clear that the 600p's random write performance improves from QD1 to QD2, but after that all we're seeing in this graph is the same steady state variations we saw in the hour-long QD32 consistency test, potentially with some thermal throttling.
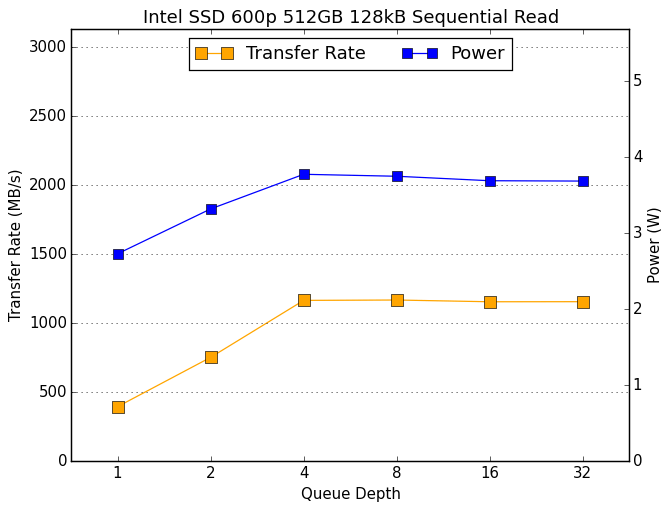
Sequential Read Performance
The sequential read test requests 128kB blocks and tests queue depths ranging from 1 to 32. The queue depth is doubled every three minutes, for a total test duration of 18 minutes. The test spans the entire drive, and the drive is filled before the test begins. The primary score we report is an average of performances at queue depths 1, 2 and 4, as client usage typically consists mostly of low queue depth operations.
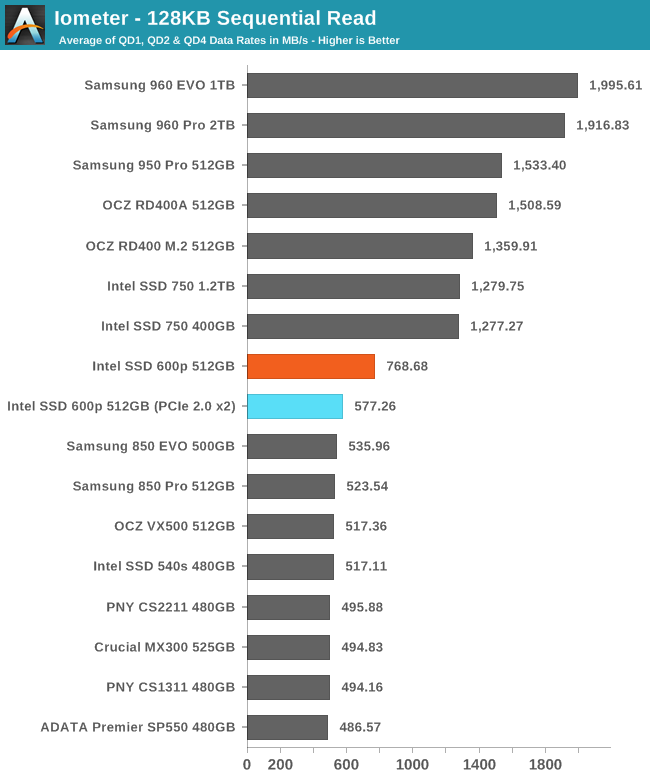
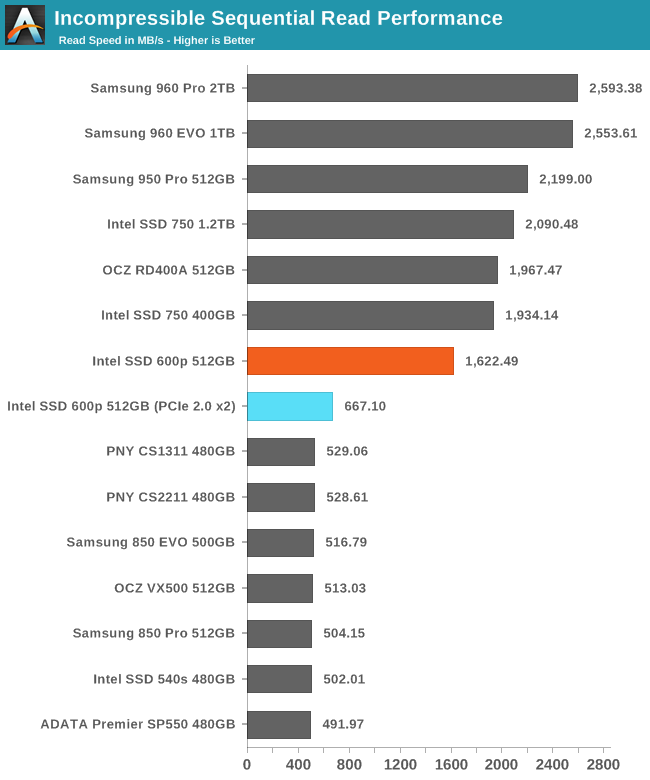
Even when limited to PCIe 2.0 x2 the 600p has slightly higher sequential read speed than SATA drives can manage, but when given more PCIe bandwidth the 600p doesn't catch up to the more expensive NVMe drives.
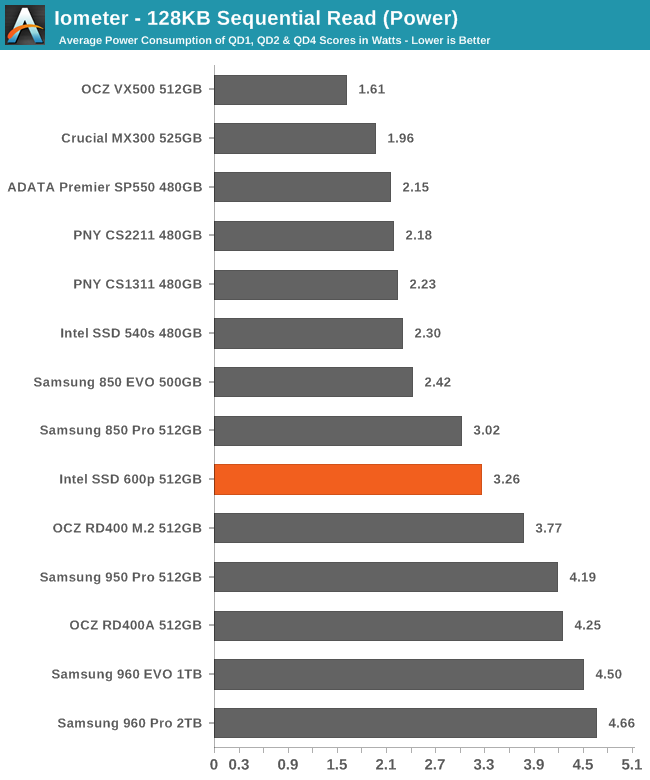
The 600p actually manages to surpass the power efficiency of several SATA SSDs, but it can't compete with the other NVMe drives that deliver twice the data rate.
 |
|||||||||
The 600p starts at just under 400MB/s hits its read speed limit at QD4 with around 1150MB/s. The other PCIe SSDs perform at least that well at QD1 and go up from there.
Sequential Write Performance
The sequential write test writes 128kB blocks and tests queue depths ranging from 1 to 32. The queue depth is doubled every three minutes, for a total test duration of 18 minutes. The test spans the entire drive, and the drive is filled before the test begins. The primary score we report is an average of performances at queue depths 1, 2 and 4, as client usage typically consists mostly of low queue depth operations.
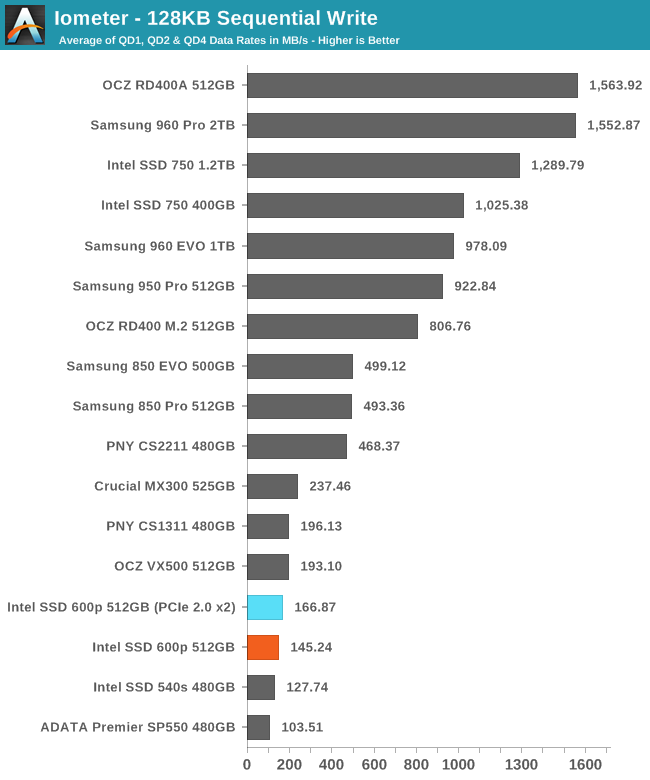
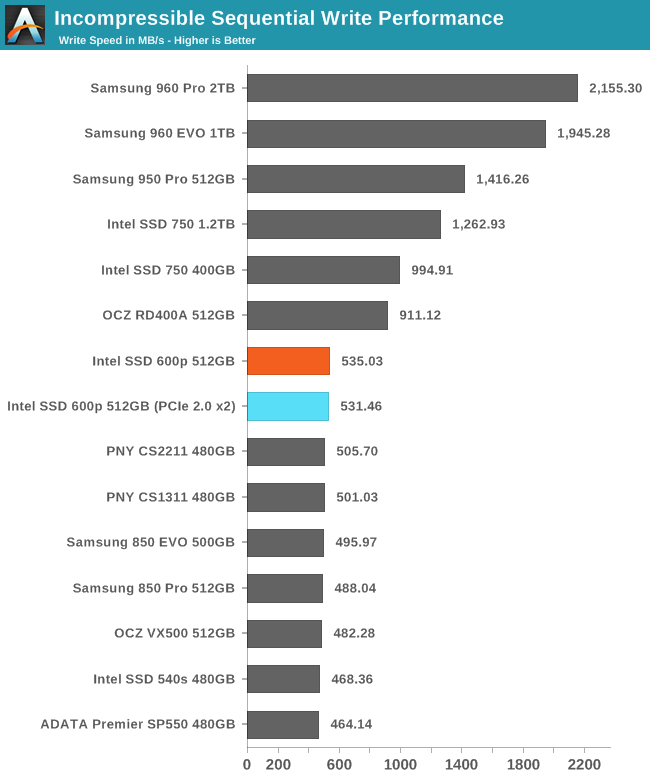
It is a surprise to see the Intel 600p performing better in the motherboard's M.2 slot than in the PCIe 3.0 adapter, but in both cases the sustained write speeds are so slow that the interface is not a limitation.
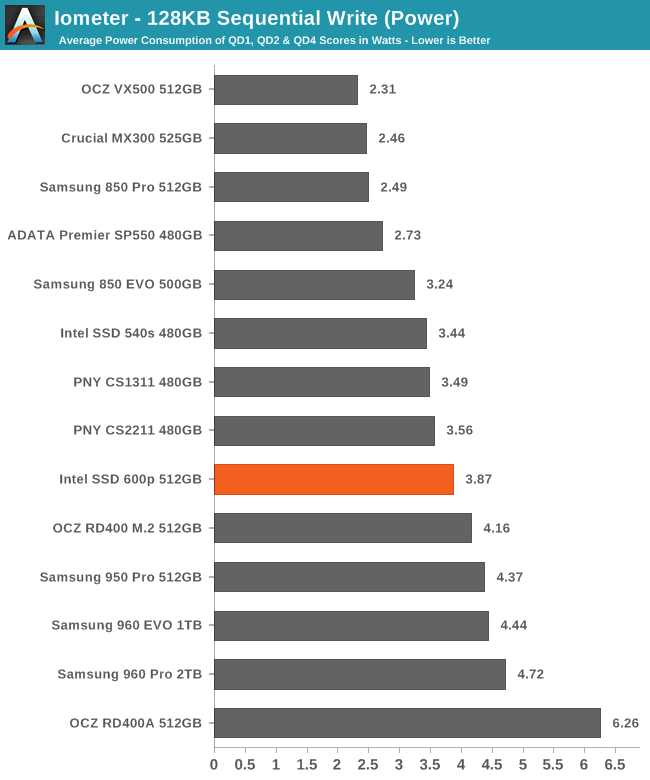
The power consumption of the 600p when it's in the PCIe 3.0 adapter is high enough that temperature may be a factor in this test, and the 600p may have performed better in the motherboard's M.2 slot simply due to better positioning and orientation in the case.
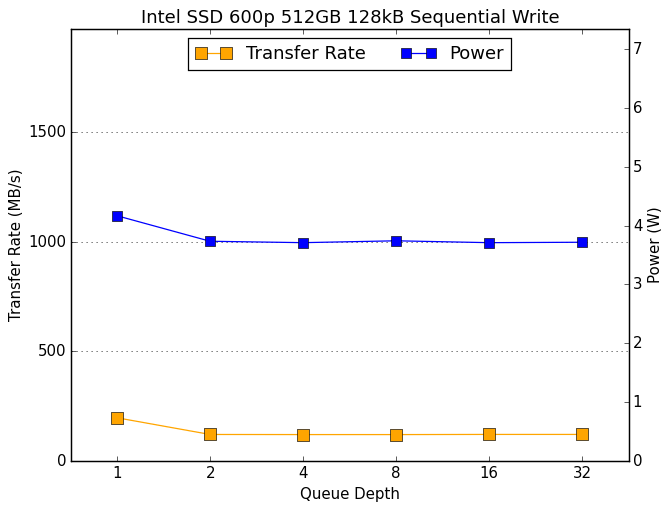 |
|||||||||
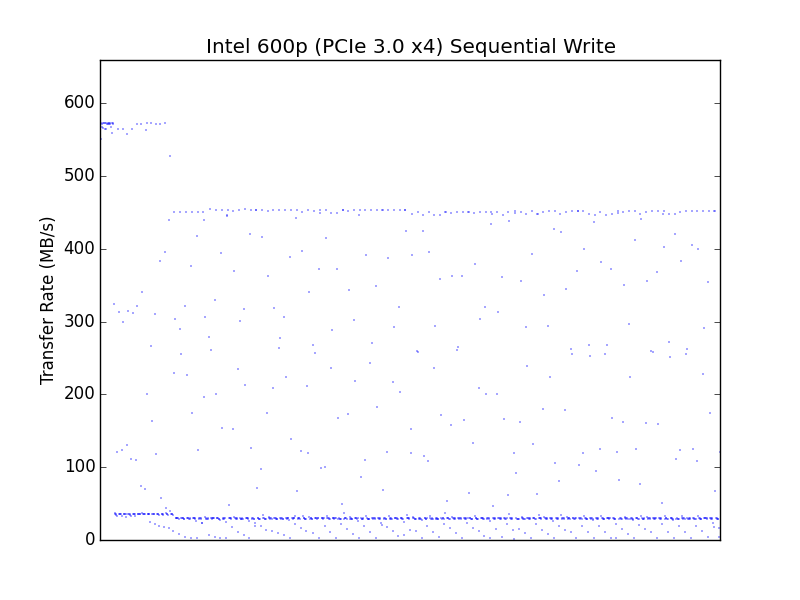
It is a familiar pattern for PCIe SSDs to see the highest write speeds at the beginning of the test, and a completely flat graph thereafter as thermal limits kick in. We're just used to seeing the performance curve near the top of the graph instead of at the bottom.
 |
|||||||||
| PCIe 3.0 x4 adapter | motherboard M.2 PCIe 2.0 x2 | ||||||||
A comparison of the second by second performance during the sequential write test shows that the 600p reaches a steady state with the same kind of inconsistency we saw for random writes, and in the PCIe 3.0 adapter the performance is reduced across the board and the worst drops in performance are much closer to zero.
Mixed Random Read/Write Performance
The mixed random I/O benchmark starts with a pure read test and gradually increases the proportion of writes, finishing with pure writes. The queue depth is 3 for the entire test and each subtest lasts for 3 minutes, for a total test duration of 18 minutes. As with the pure random write test, this test is restricted to a 16GB span of the drive, which is empty save for the 16GB test file.
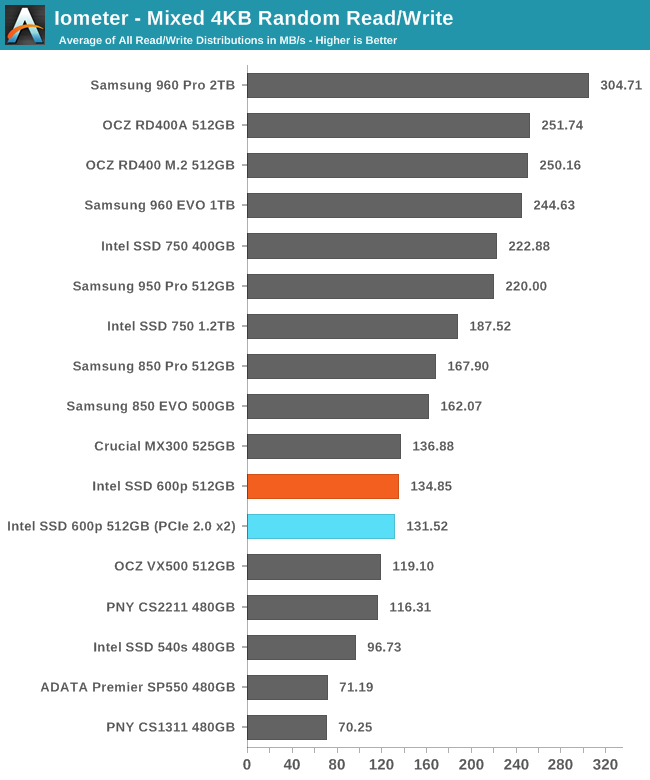
The 600p was slower than the Crucial MX300 on random writes but faster at random reads. On the mixed random I/O test, they average out to a tie.
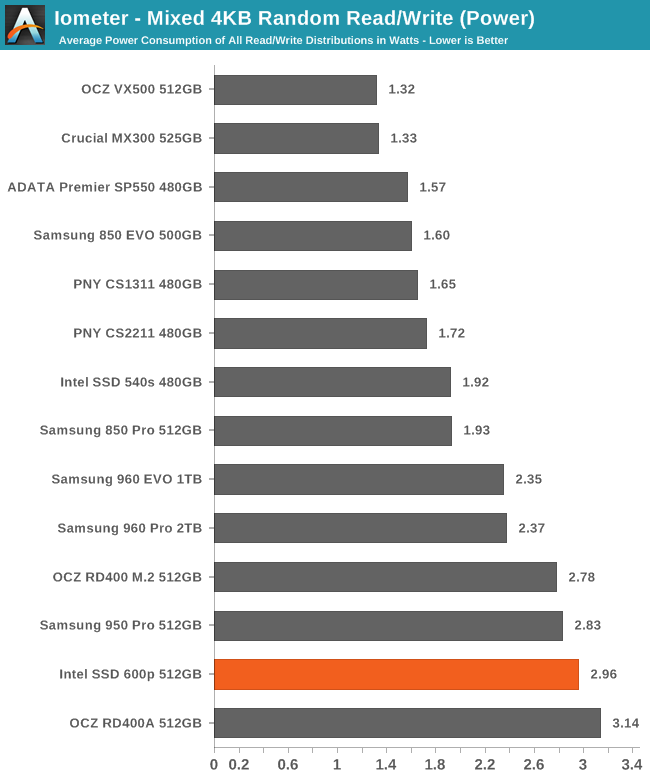
Despite performing the same overall, the 600p used more than twice the power of the MX300. The SM2260 controller simply imposes far too much power overhead than is appropriate when paired with slow TLC NAND.
 |
|||||||||
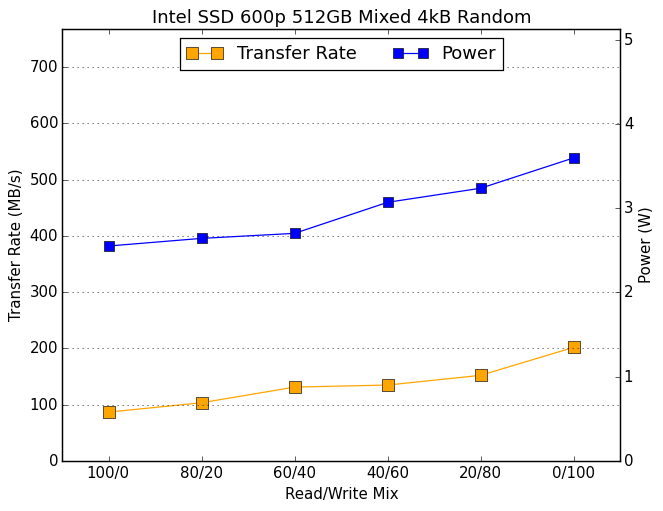
The 600p performs better as more writes are added in to the mix, but it doesn't spike in performance for the final all-writes phase of the test. This means its performance is much more balanced than many other drives that simply run up the score at the end.
Mixed Sequential Read/Write Performance
The mixed sequential access test covers the entire span of the drive and uses a queue depth of one. It starts with a pure read test and gradually increases the proportion of writes, finishing with pure writes. Each subtest lasts for 3 minutes, for a total test duration of 18 minutes. The drive is filled before the test starts.
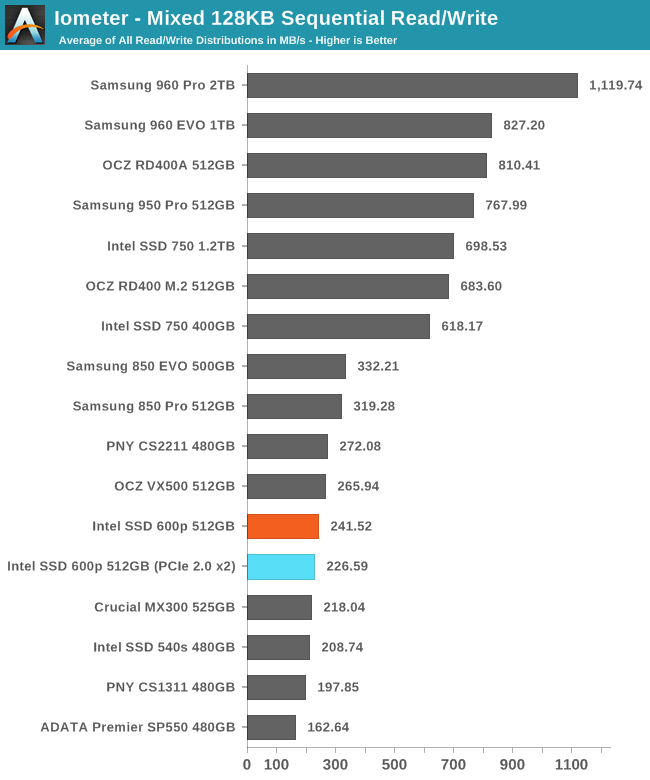
The faster-than-SATA read speeds of the 600p aren't enough to compensate for the poor write speeds, so it ends up scoring only slightly ahead of the budget SATA SSDs.
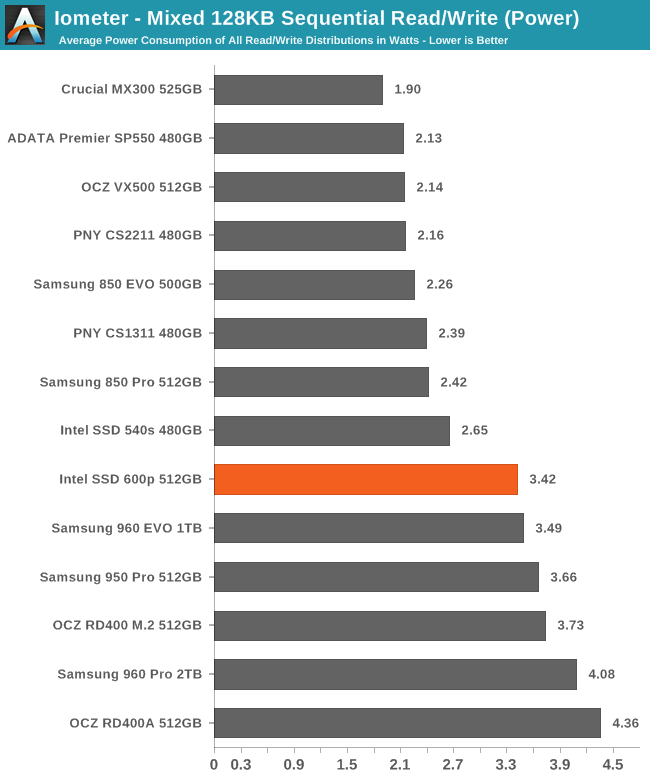
There is a clear separation in power consumption between the SATA and PCIe SSDs. For once, the 600p is the lowest power PCIe SSD, but it is still the least efficient due to its low performance.
 |
|||||||||
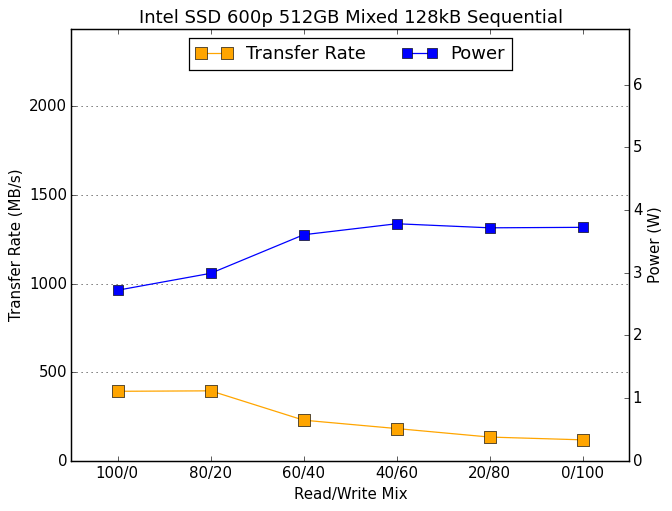
As expected, adding writes to the mix drags down performance, though there aren't enough writes in the 80/20 phase to have much of an impact yet. It is a hallmark of low-end SSDs to see performance stay low through the end of the test, while high-performance SSDs typically have a U-shaped performance curve here.
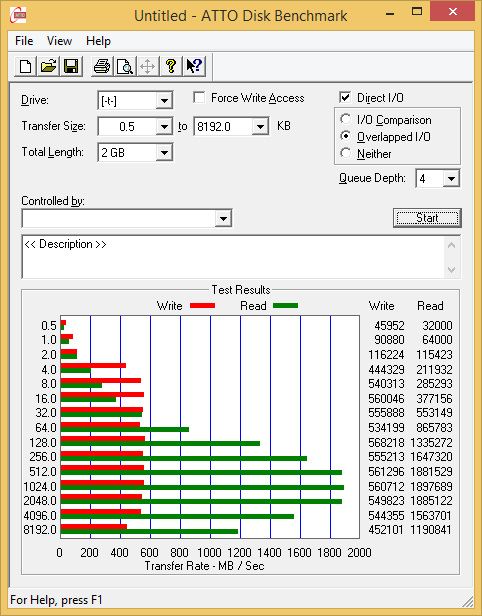
ATTO
ATTO's Disk Benchmark is a quick and easy freeware tool to measure drive performance across various transfer sizes.
 |
|||||||||
Both read and write speeds fall off toward the end of the ATTO test, indicating that thermal throttling is starting to happen. When limited to PCIe 2.0 x2, the performance is somewhat variable and does not show any clear signs of thermal throttling.
AS-SSD
AS-SSD is another quick and free benchmark tool. It uses incompressible data for all of its tests, making it an easy way to keep an eye on which drives are relying on transparent data compression. The short duration of the test makes it a decent indicator of peak drive performance.
On the short AS-SSD test, the 600p delivers a great sequential read speed that puts it pretty close to high-end NVMe drives. Write speeds are just a hair over what SATA drives can achieve.
Idle Power Consumption
Since the ATSB tests based on real-world usage cut idle times short to 25ms, their power consumption scores paint an inaccurate picture of the relative suitability of drives for mobile use. During real-world client use, a solid state drive will spend far more time idle than actively processing commands.
There are two main ways that a NVMe SSD can save power when idle. The first is through suspending the PCIe link through the Active State Power Management (ASPM) mechanism, analogous to the SATA Link Power Management mechanism. Both define two power saving modes: an intermediate power saving mode with strict wake-up latency requirements (eg. 10µs for SATA "Partial" state) and a deeper state with looser wake-up requirements (eg. 10ms for SATA "Slumber" state). SATA Link Power Management is supported by almost all SSDs and host systems, though it is commonly off by default for desktops. PCIe ASPM support on the other hand is a minefield and it is common to encounter devices that do not implement it or implement it incorrectly. Forcing PCIe ASPM on for a system that defaults to disabling it may lead to the system locking up; this is the case for our current SSD testbed and thus we are unable to measure the effect of PCIe ASPM on SSD idle power.
The NVMe standard also defines a drive power management mechanism that is separate from PCIe link power management. The SSD can define up to 32 different power states and inform the host of the time taken to enter and exit these states. Some of these power states can be operational states where the drive continues to perform I/O with a restricted power budget, while others are non-operational idle states. The host system can either directly set these power states, or it can declare rules for which power states the drive may autonomously transition to after being idle for different lengths of time.
The big caveat to NVMe power management is that while I am able to manually set power states under Linux using low-level tools, I have not yet seen any OS or NVMe driver automatically engage this power saving. Work is underway to add Autonomous Power State Transition (APST) support to the Linux NVMe driver, and it may be possible to configure Windows to use this capability with some SSDs and NVMe drivers. NVMe power management including APST fortunately does not depend on motherboard support the way PCIe ASPM does, so it should eventually reach the same widespread availability that SATA Link Power Management enjoys.
We report two idle power values for each drive: an active idle measurement taken with none of the above power management states engaged, and an idle power measurement with either SATA LPM Slumber state or the lowest-power NVMe non-operational power state, if supported.
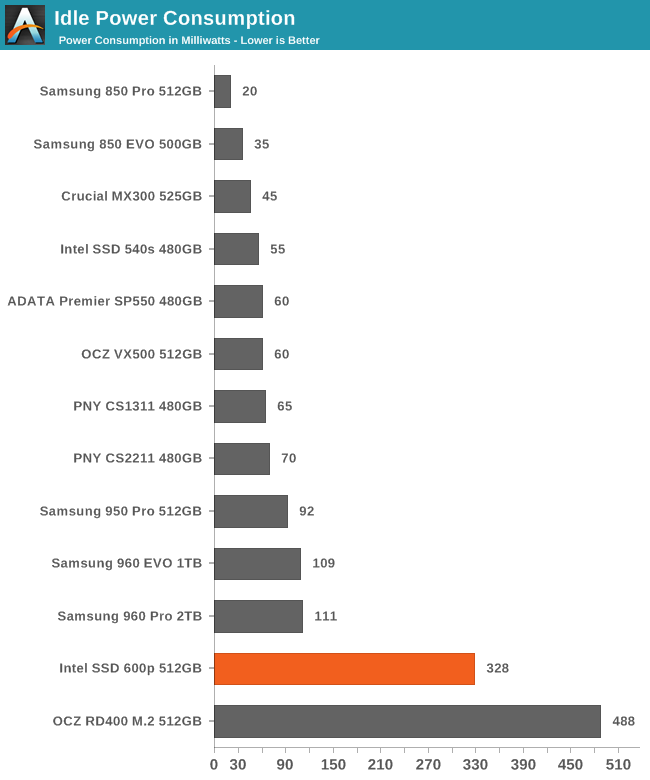
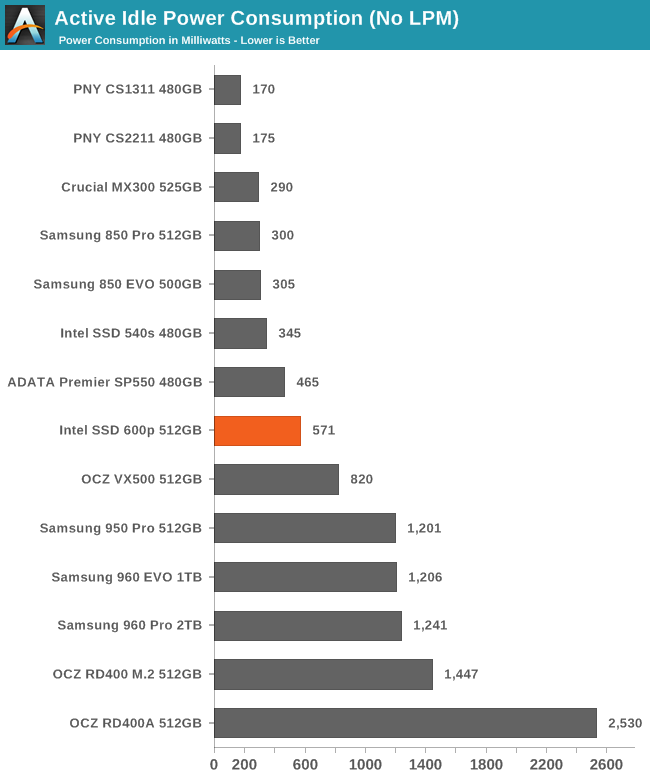
Silicon Motion has made a name for themselves with very low power SSDs. The SM2260 used in the Intel 600p doesn't really keep that tradition alive. It does support NVMe power saving modes, but they don't accomplish much. The active idle power consumption without NVMe power saving modes is much better than the other PCIe SSDs we've tested, but still relatively high by the standards of SATA SSDs.
Final Words
The Intel SSD 600p is intended to be the most mainstream PCIe SSD yet without the hefty price premium that previous PCIe SSDs have carried relative to SATA SSDs. Its performance needs to be evaluated in the context of its price and intended market, both of which are quite different from that of products like the Samsung 960 Pro and 960 EVO. The more appropriate standard to compare against is the Samsung 850 EVO.
Even with our expectations thus lowered, the Intel SSD 600p fails to measure up. But this isn't a simple case of a budget drive that turns out to be far slower than its specifications would imply. The SSD 600p does offer peak performance that is as high as promised. The trouble is that it only provides that performance in a narrow range of circumstances, and most of our usual benchmarks go far beyond that and show the 600p at its worst.
The biggest problem with the Intel SSD 600p seems to be its implementation of SLC caching. The cache is plenty and its fixed size prevents the drive from performing vastly worse when full, the way the Crucial MX300 and OCZ VX500 suffer. But the 600p sends all writes through the SLC cache even when it is full, which creates extra work for the SSD controller, and the SM2260 can't keep up. Once the SLC cache has been filled, further sustained writes will put the drive through frequent garbage collection cycles to flush part of the SLC cache. While that extra background work is proceeding, the 600p slows to a crawl and peak write latencies can spike to over half a second.
In the early days of the SSD market, many drives and controllers were condemned for seizing up under load. The SSD 600p reminds us of those problems, but it isn't so severely crippled. The SSD 600p is completely unsuitable for a database server, but at its worst is is only as bad as a budget SATA SSD, not a dying hard drive. Ordinary interactive desktop usage provides the SSD 600p plenty of idle time to clean up and the 600p will perform better than any SATA SSD. Even when the 600p is subjected to an unrealistically intense sustained write load, its stutters are very brief and in between it catches up very quickly with bursts of very high performance. In spite of its problems, the SSD 600p managed a steady-state random write speed higher than almost all consumer SATA SSDs.
The Intel SSD 600p would be a bad choice for a user who regularly shuffles around tens of gigabytes of data. On paper however, it offers great performance for light workloads. The problem is that for workloads light enough to never expose the 600p's flaws, even a slower and cheaper SATA SSD is plenty fast and the 600p's advantages would be difficult to feel (bar installation in a smaller form factor). The niche that the SSD 600p is most suited for is also one that doesn't need a faster SSD. The SSD 600p doesn't set any records for price per gigabyte except among NVMe SSDs, and its power efficiency is a problem for mobile users. Taken together, these factors mean that users for whom the SSD 600p would work well will almost always be better served by getting a cheaper and possibly larger SATA SSD if they have the space.
| 128GB | 250-256GB | 400-512GB | 1TB | 2TB | |
| Samsung 960 EVO (MSRP) | $129.88 (52¢/GB) | $249.99 (50¢/GB) | $479.99 (48¢/GB) | ||
| Samsung 960 Pro (MSRP) | $329.99 (64¢/GB) | $629.99 (62¢/GB) | $1299.99 (63¢/GB) | ||
| Plextor M8Pe | $74.99 (59¢/GB) | $114.99 (45¢/GB) | $189.99 (37¢/GB) | $414.99 (41¢/GB) | |
| Intel SSD 600p | $63.99 (50¢/GB) | $79.99 (31¢/GB) | $164.53 (32¢/GB) | $302.99 (30¢/GB) | |
| Samsung 850 EVO | $94.99 (38¢/GB) | $164.99 (33¢/GB) | $314.90 (32¢/GB) | $624.99 (31¢/GB) | |
| Crucial MX300 |
$69.99 (26¢/GB) | $123.09 (23¢/GB) | $244.99 (23¢/GB) | $480.00 (23¢/GB) | |
| $169.99 (23¢/GB) (750GB) | |||||
It is possible that the Intel SSD 600p's flaws could be mitigated by different firmware. The SM2260 controller is obviously capable of handling high data rates when it isn't busy unnecessarily shuffling data in and out of the SLC cache. We don't know for sure why Micron chose to cancel the Ballistix TX3 SSD that was due to use SM2260 with 3D MLC, but even if that combination wasn't going to be able to compete in the highest market segment, the controller is certainly capable of going far beyond the performance limits of SATA.
The Intel/Micron 3D TLC NAND is clearly not as fast as Samsung's 3D TLC V-NAND, but the Crucial MX300 has already shown us that the SSD 600p's limitations are not all directly the result of the NAND being too slow. It is unlikely that Intel will overhaul the firmware of the 600p, but it is quite possible that future products will do a better job with this hardware. The first product we tested with Silicon Motion's SM2256 controller was the infamous Crucial BX200, but it was followed up by successors like the ADATA SP550 that proved the SM2256 could make for a good value SSD.
The results of testing the SSD 600p in the motherboard's more limited PCIe 2.0 x2 M.2 slot bring up some interesting questions about the future of low-end NVMe products. For the most part, the effects of the bandwidth limitation on the SSD 600p were barely noticeable. PCIe 3.0 x4 is far faster than necessary to simply be faster than SATA, and supporting an interface that fast has costs in both controller die size and power consumption. The SSD 600p might have been better served by a controller that sacrificed excess host interface bandwidth to allow for a more powerful processor within the same TDP, or to just lower the price a bit further. Even though OEMs are striving to ensure that their M.2 slots can support the fastest SSD, not every drive needs to use all of that bandwidth.


